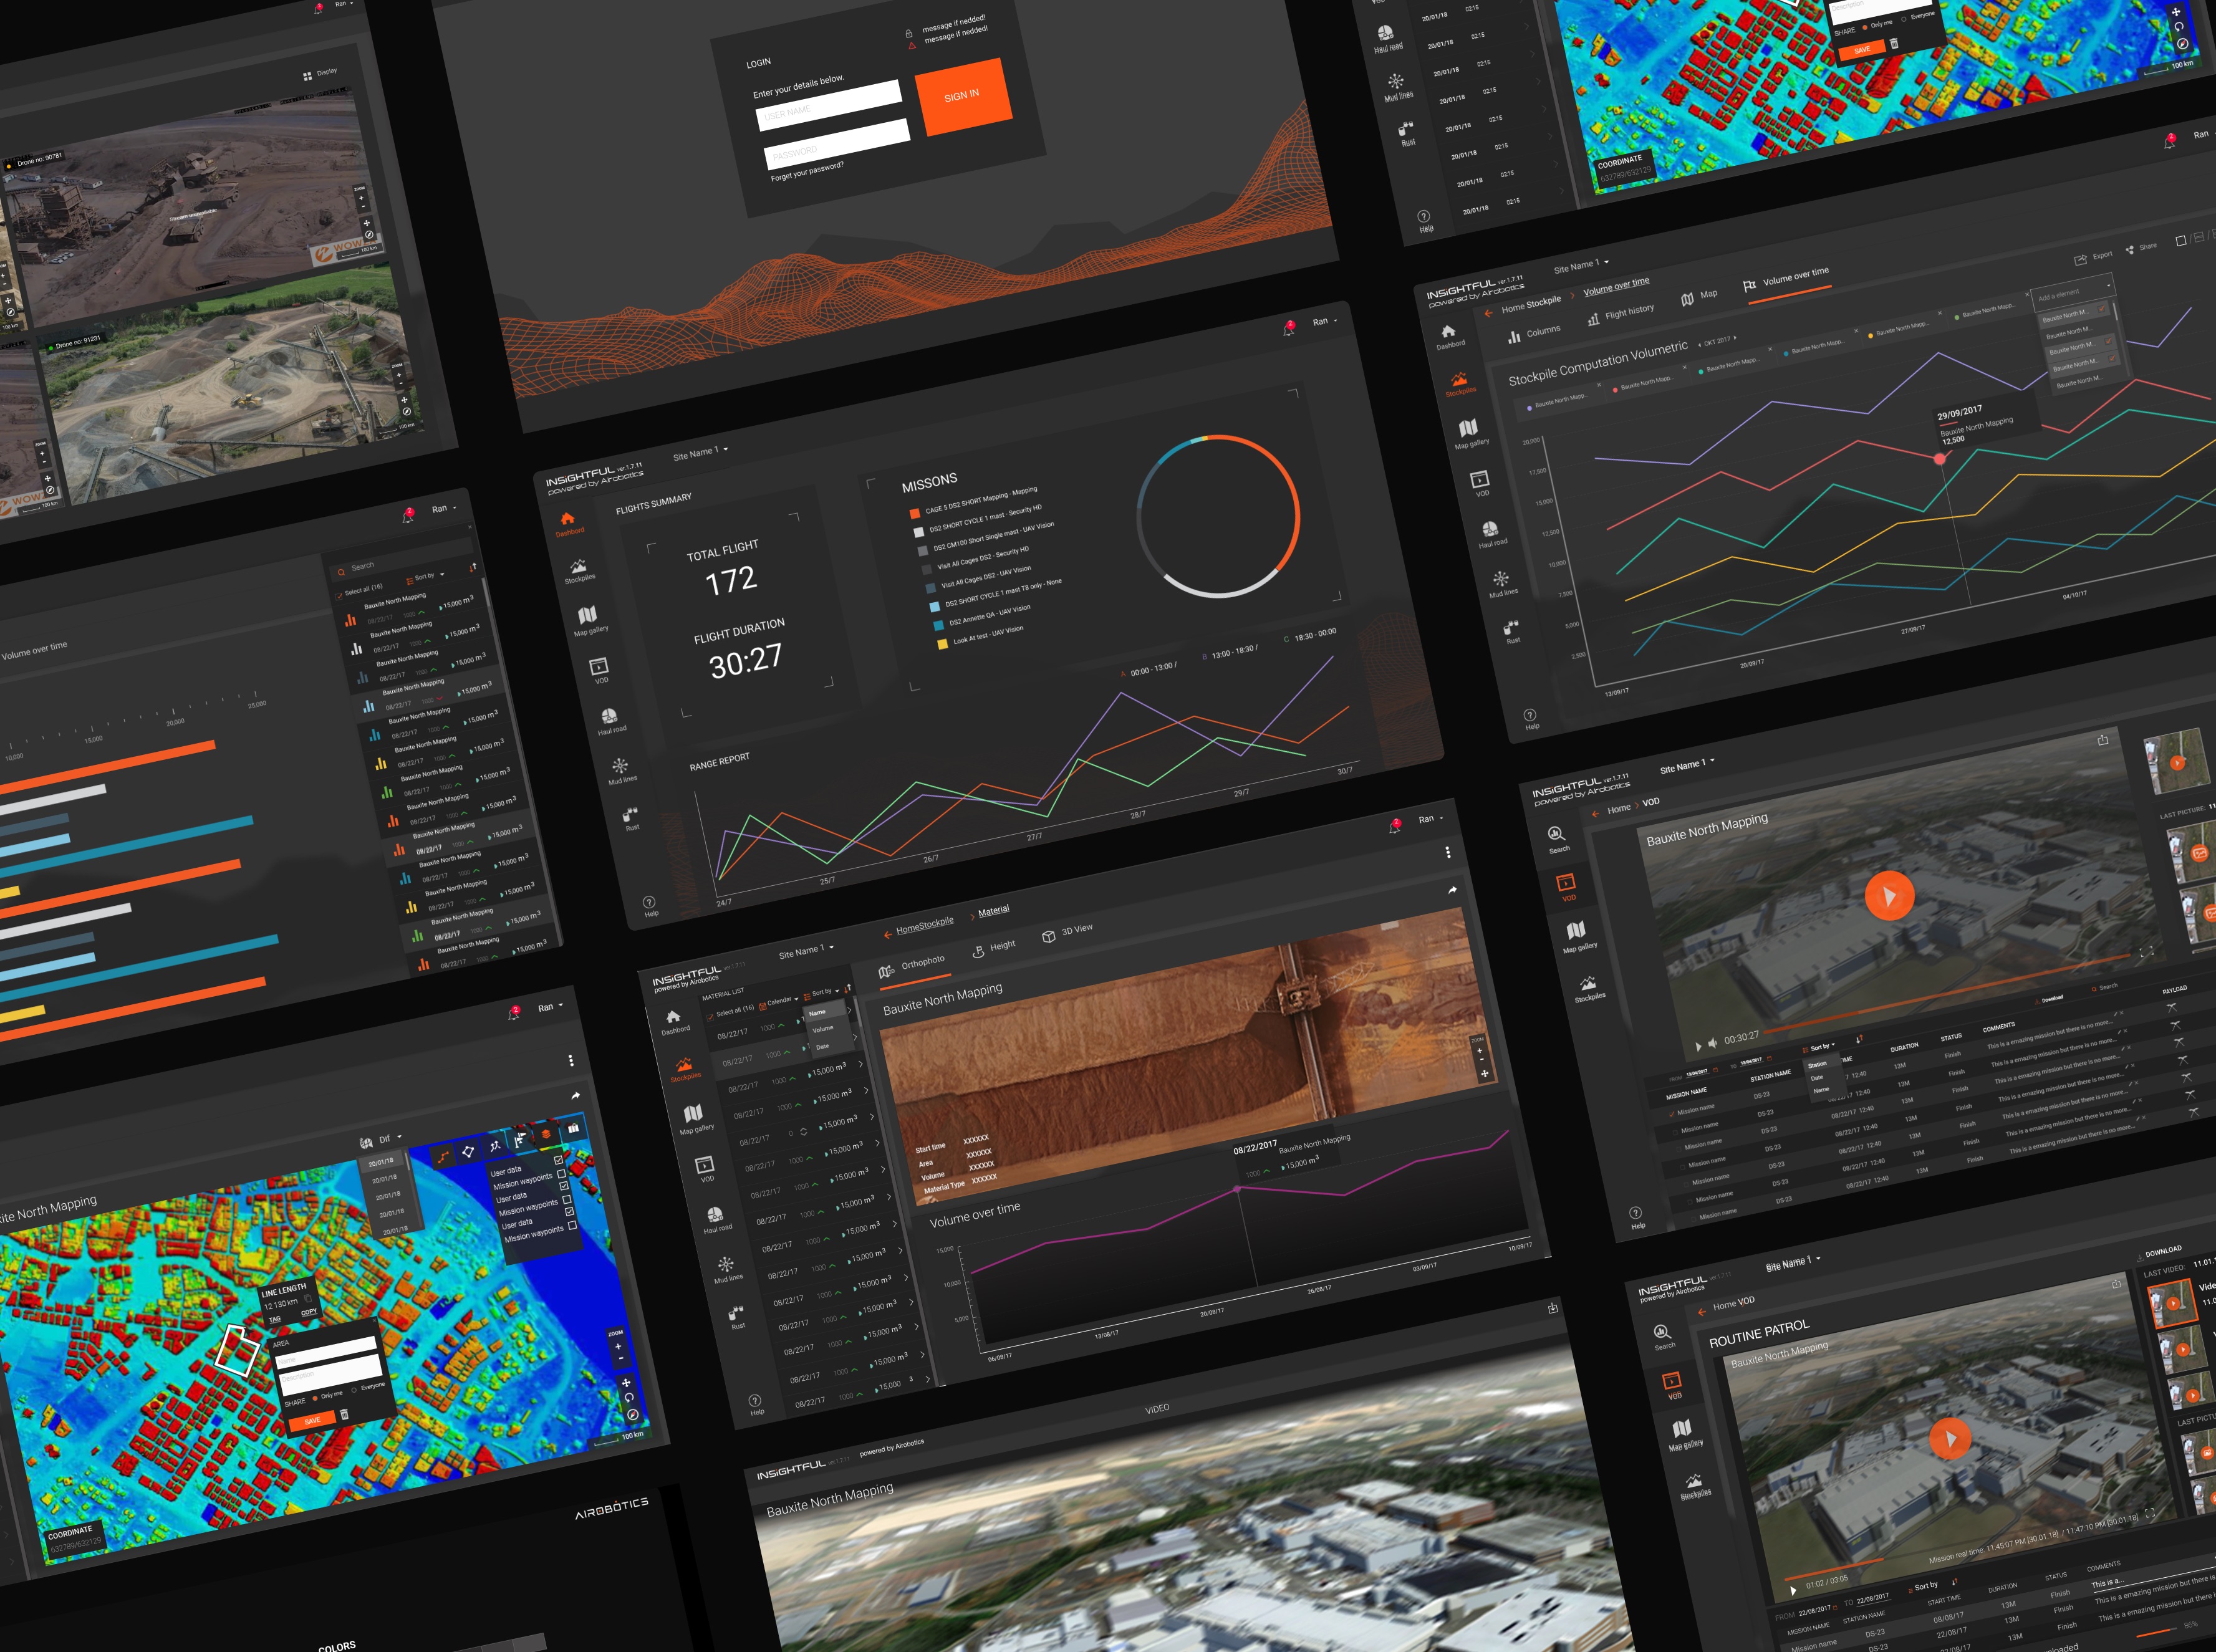
Collage of Insightful screens: flight dashboard, stockpile charts, site maps, and inspection video

Airobotics · Insightful

Turn dense flight data into readable decisions.

Insightful was Airobotics' analytics platform for drone operations at industrial sites. Operators, site managers and engineers read the same flight data at different depths: the week at a glance, or one flight in detail.

Product Design Lead Design Systems Team Leadership 2016–2018
Problem
Flight logs, mission history and performance patterns, read by three audiences who each needed a different depth.
Approach
I organised the data by what each user needed to see first: weekly summaries, the mission mix, and stockpile volume as bars and as a trend.
Result
Insightful in production, on the same design language as PRIMUS.

Context

Two products. One high-stakes environment.

Airobotics builds automated drone systems for industrial environments: refineries, chemical plants, manufacturing facilities. When I joined, both products existed as rough Photoshop prototypes: inconsistent by screen, built without a shared interaction language, designed without a system underneath.

Over three years, I shaped two production platforms: PRIMUS for real-time mission control, and Insightful for post-flight analytics. My role spanned product design, design leadership, and building the infrastructure that let the product scale without losing coherence. This case is about Insightful. Mission control has its own case: Airobotics PRIMUS.

The Challenge

Same data. Three audiences. Different depths.

In mission-critical software, ambiguity is not a usability issue. It is an operational risk.

Insightful was an analytics platform designed to turn flight logs, mission history, and performance patterns into decisions operators and managers could actually act on.

01 · High-density information competing for the same attention

Operators needed to simultaneously read live drone state, active mission context, weather, and spatial map data without losing confidence or speed. The original design gave everything equal visual weight, so nothing had real priority when it needed it.
02 · No design foundation to build from or scale on

Both products started in Photoshop: no shared component system, no interaction patterns, no design process. Every screen was its own isolated decision. Without a shared language, every new feature introduced more inconsistency into an already complex product.

Key Decision

I stopped talking about design quality and started talking about build speed.

The most important design decision in this project was not a layout or a workflow. It was proving that a design system would help engineering ship faster, and framing it that way to the right person.

When I proposed building a proper design system, the Head of Software Development saw it as overhead. The team needed features now. Design infrastructure looked like a delay: something to revisit after the product matured, not during active development.

How it was framed

A design system is overhead. The team needs features now. Design infrastructure is a delay: something to revisit after the product matures, not during active development.

The reframe

Shared components, clearer patterns, and reliable handoff reduce guesswork and prevent repeated UI decisions. Not a cost to the roadmap. The thing that makes the roadmap move faster.

To keep the effort practical, I used Material Design as a starting point instead of inventing everything from scratch, and moved the workflow from Photoshop to Adobe XD so components and prototypes could live inside the working files. The full story of that argument is in the PRIMUS case.

Design Moves

Two decisions that shaped Insightful.

Two choices that shaped how people read the data, each made under constraint, each with a reason that goes beyond the visual result.

Move 01

Turn dense flight data into readable decisions.

Insightful served three audiences: operators checking their own performance, site managers reviewing fleet activity, engineers investigating issues. The same data needed to be legible at a glance and support deeper analysis when required.

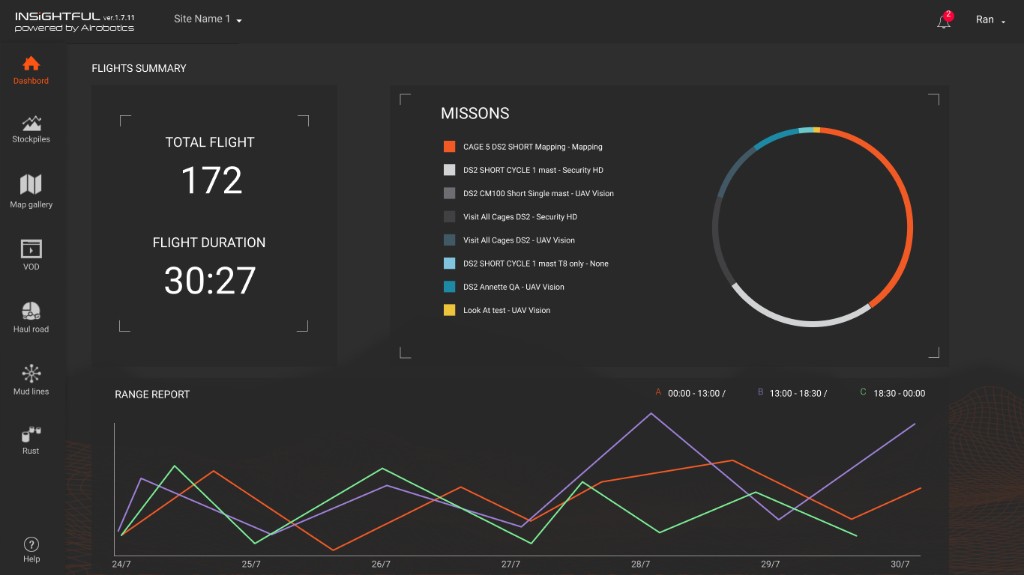
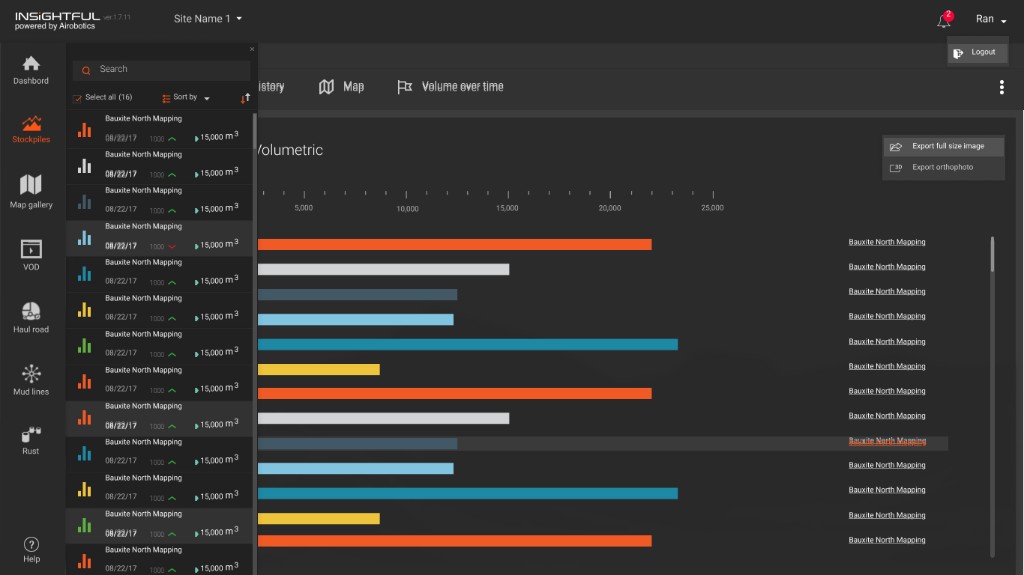
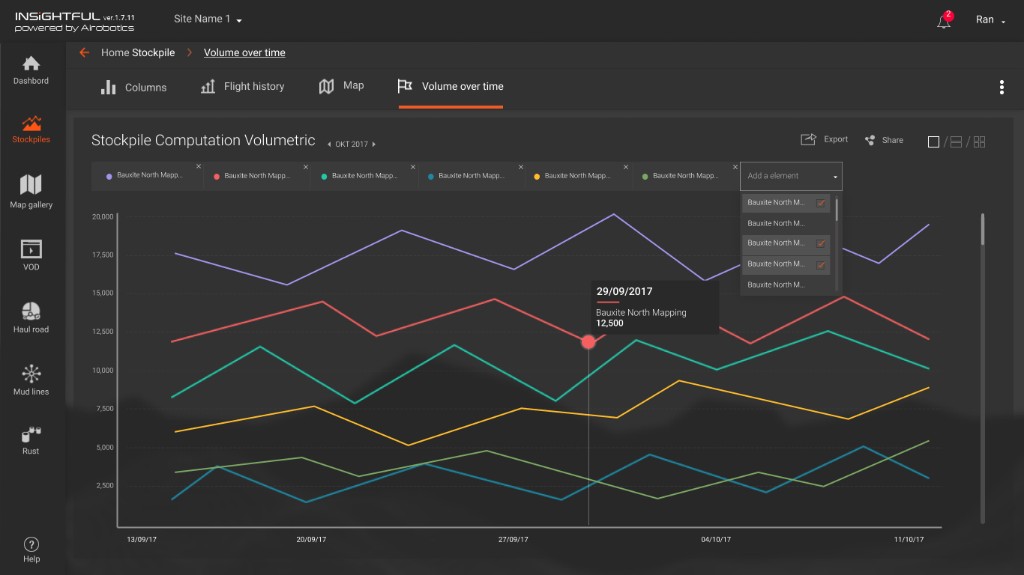
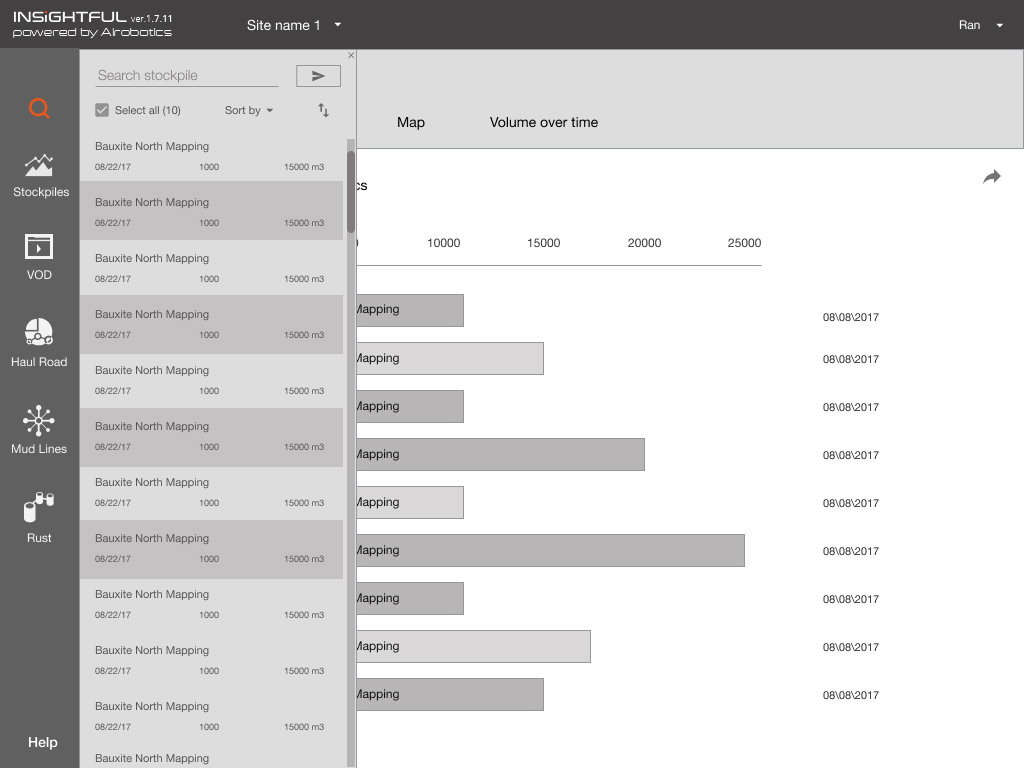
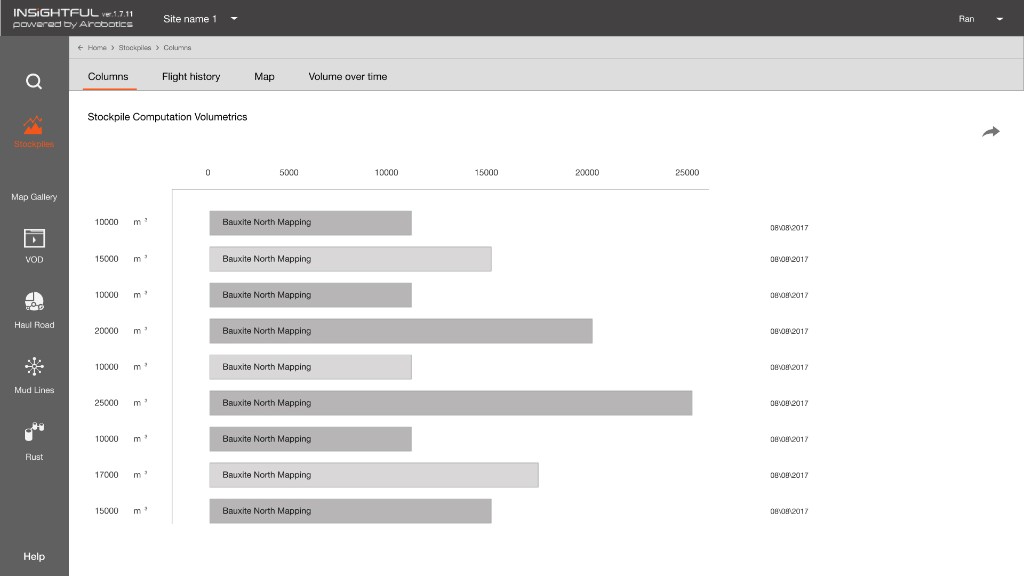
Weekly summaries, mission distribution, and performance patterns were organized by what users needed to see first, not by what was technically available. Site managers tracked the week. Engineers could open any one flight and see the detail. Stockpile volume sat as bars and as a trend, so a site manager could compare one week with the week before, and a map gallery, 4K photos and VOD of the flight recordings were in one place.

The challenge was not to simplify data until it lost meaning. It was to create enough hierarchy that people could understand what mattered first, then go deeper.

Insightful tablet view: stockpile list with sidebar navigation and volume-over-time chart Insightful web view: stockpile computation volumetrics bar chart with operational hierarchy

Move 02

One product model. Four platforms. No relearning.

Operators moved between Windows workstations in control rooms, tablets in the field, browser access, and mobile extensions. The product had to stay coherent across all of them: not identical, but consistent enough that users never had to relearn spatial logic or interaction patterns when the device changed.

Core interaction patterns held. Density and input method adapted. In high-stakes environments, users should not have to re-learn the product each time the context changes.

Wireframes

Same dashboard, from grayscale to the product theme.

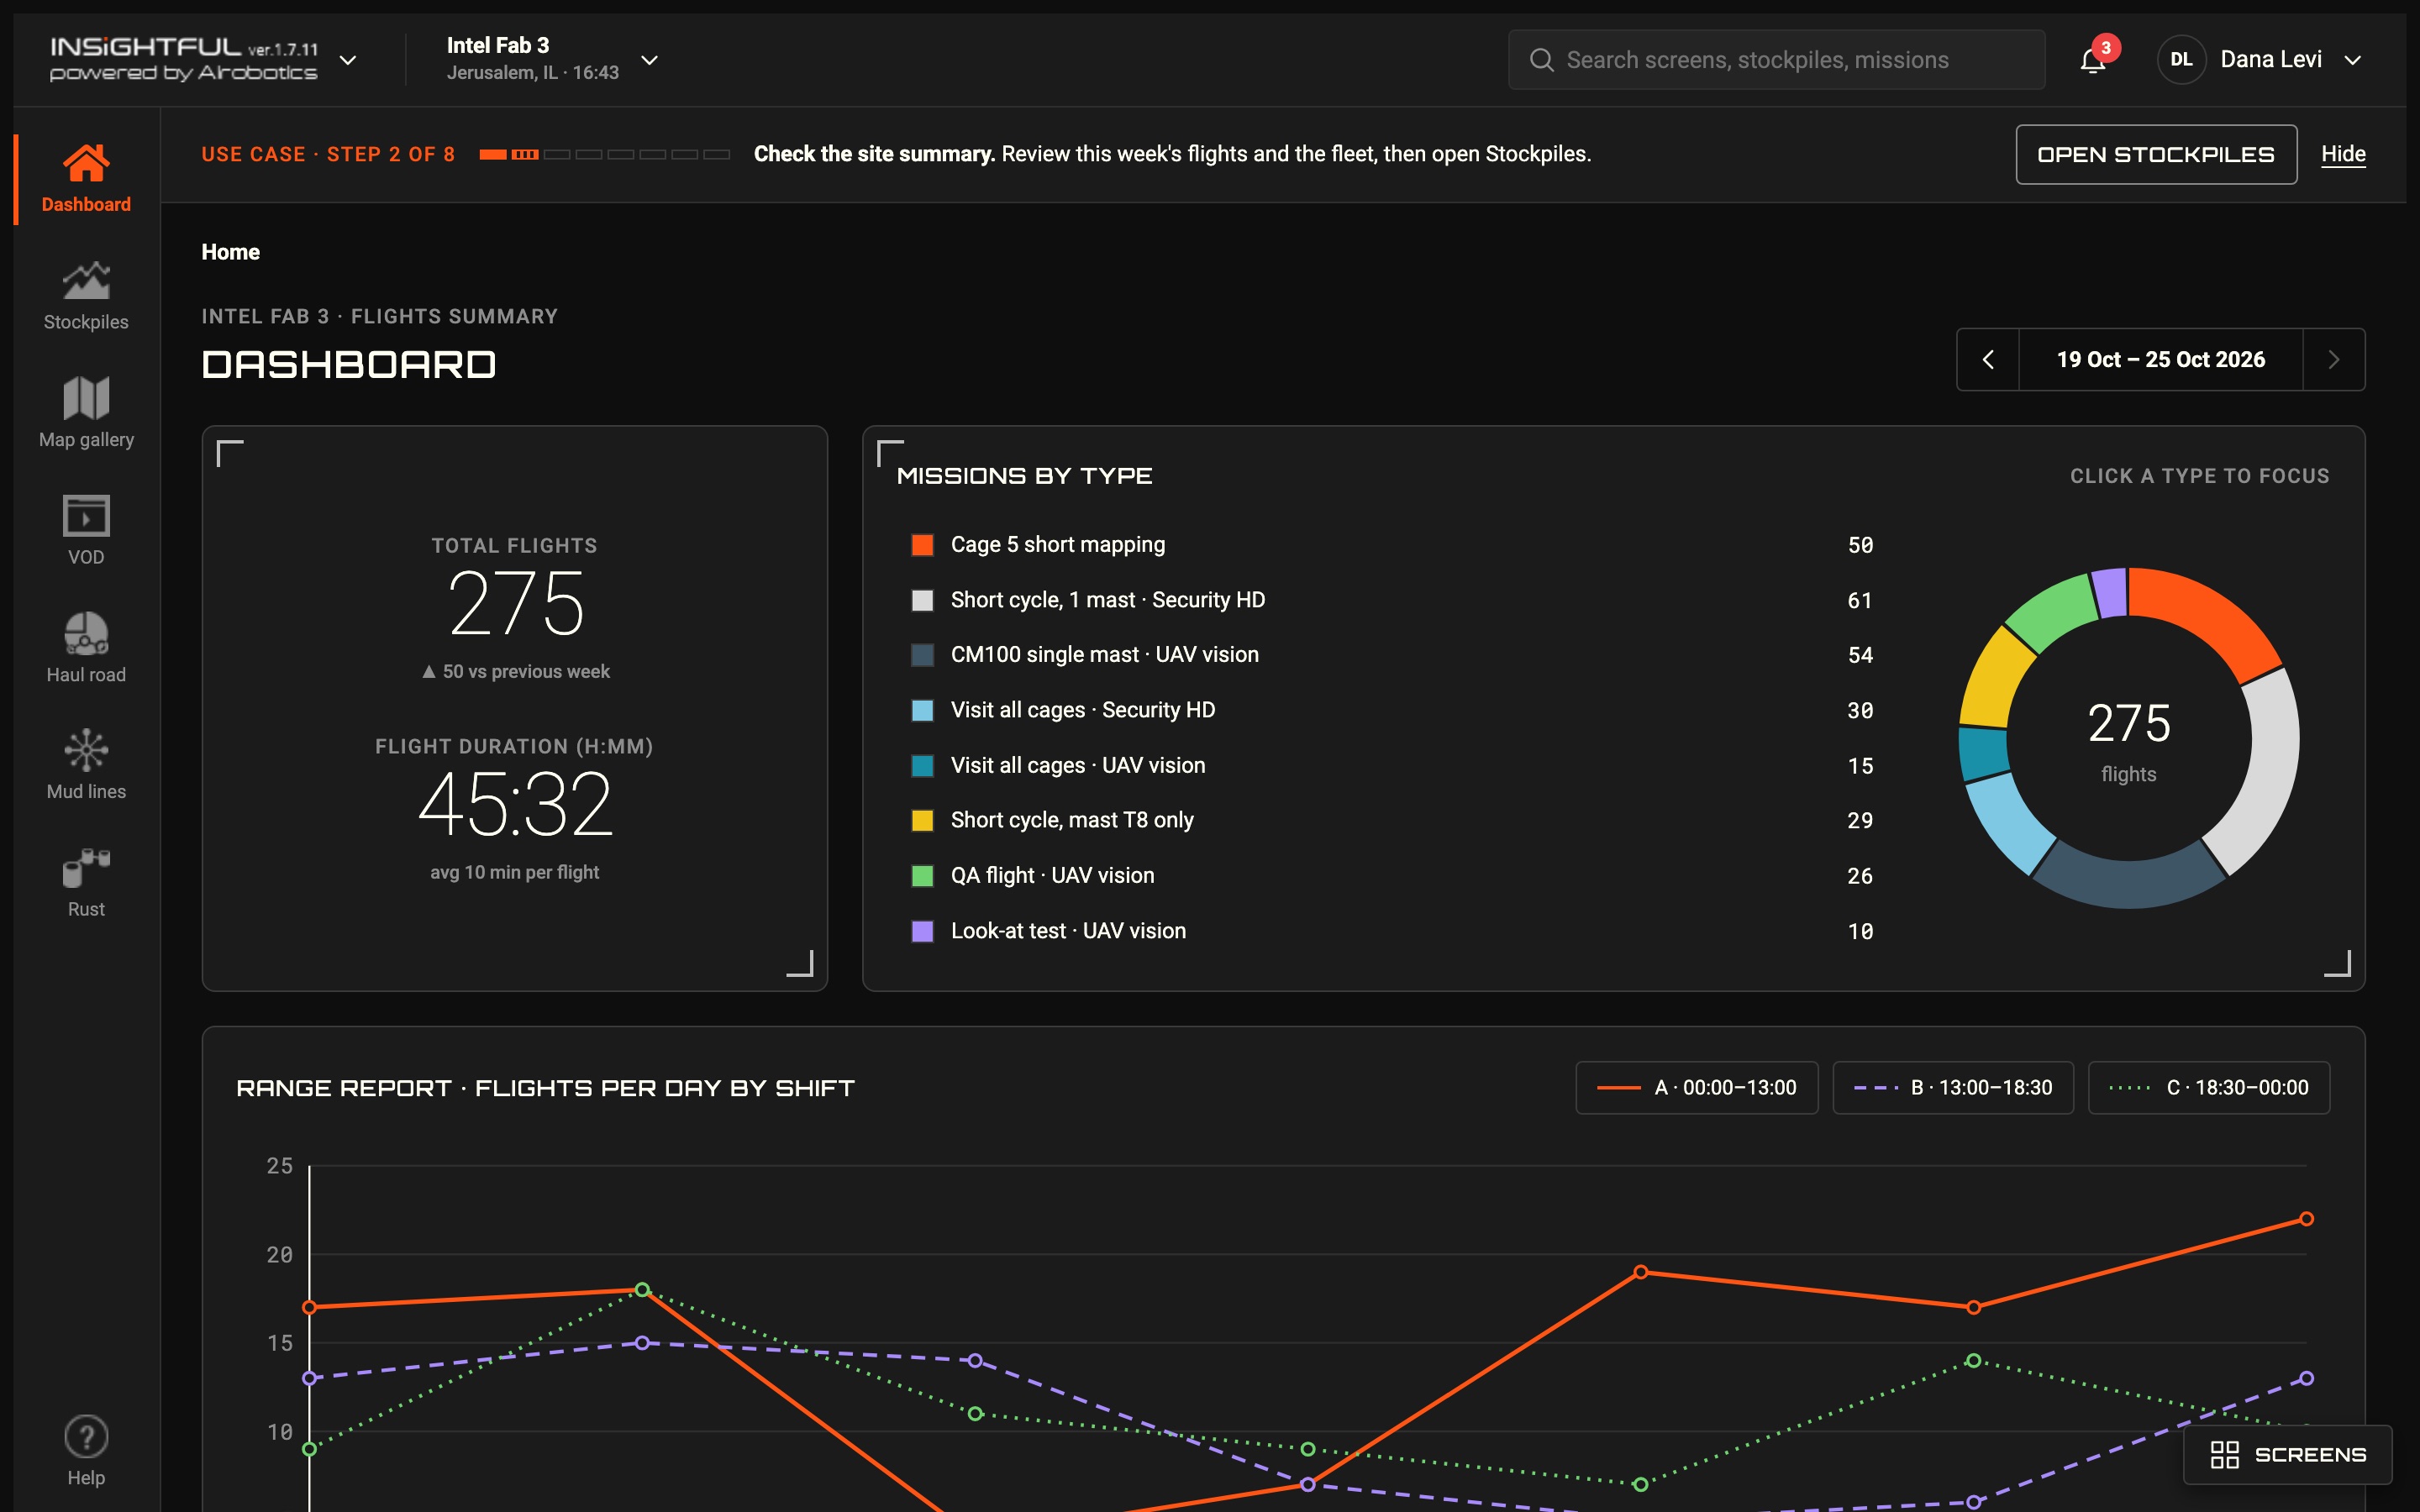
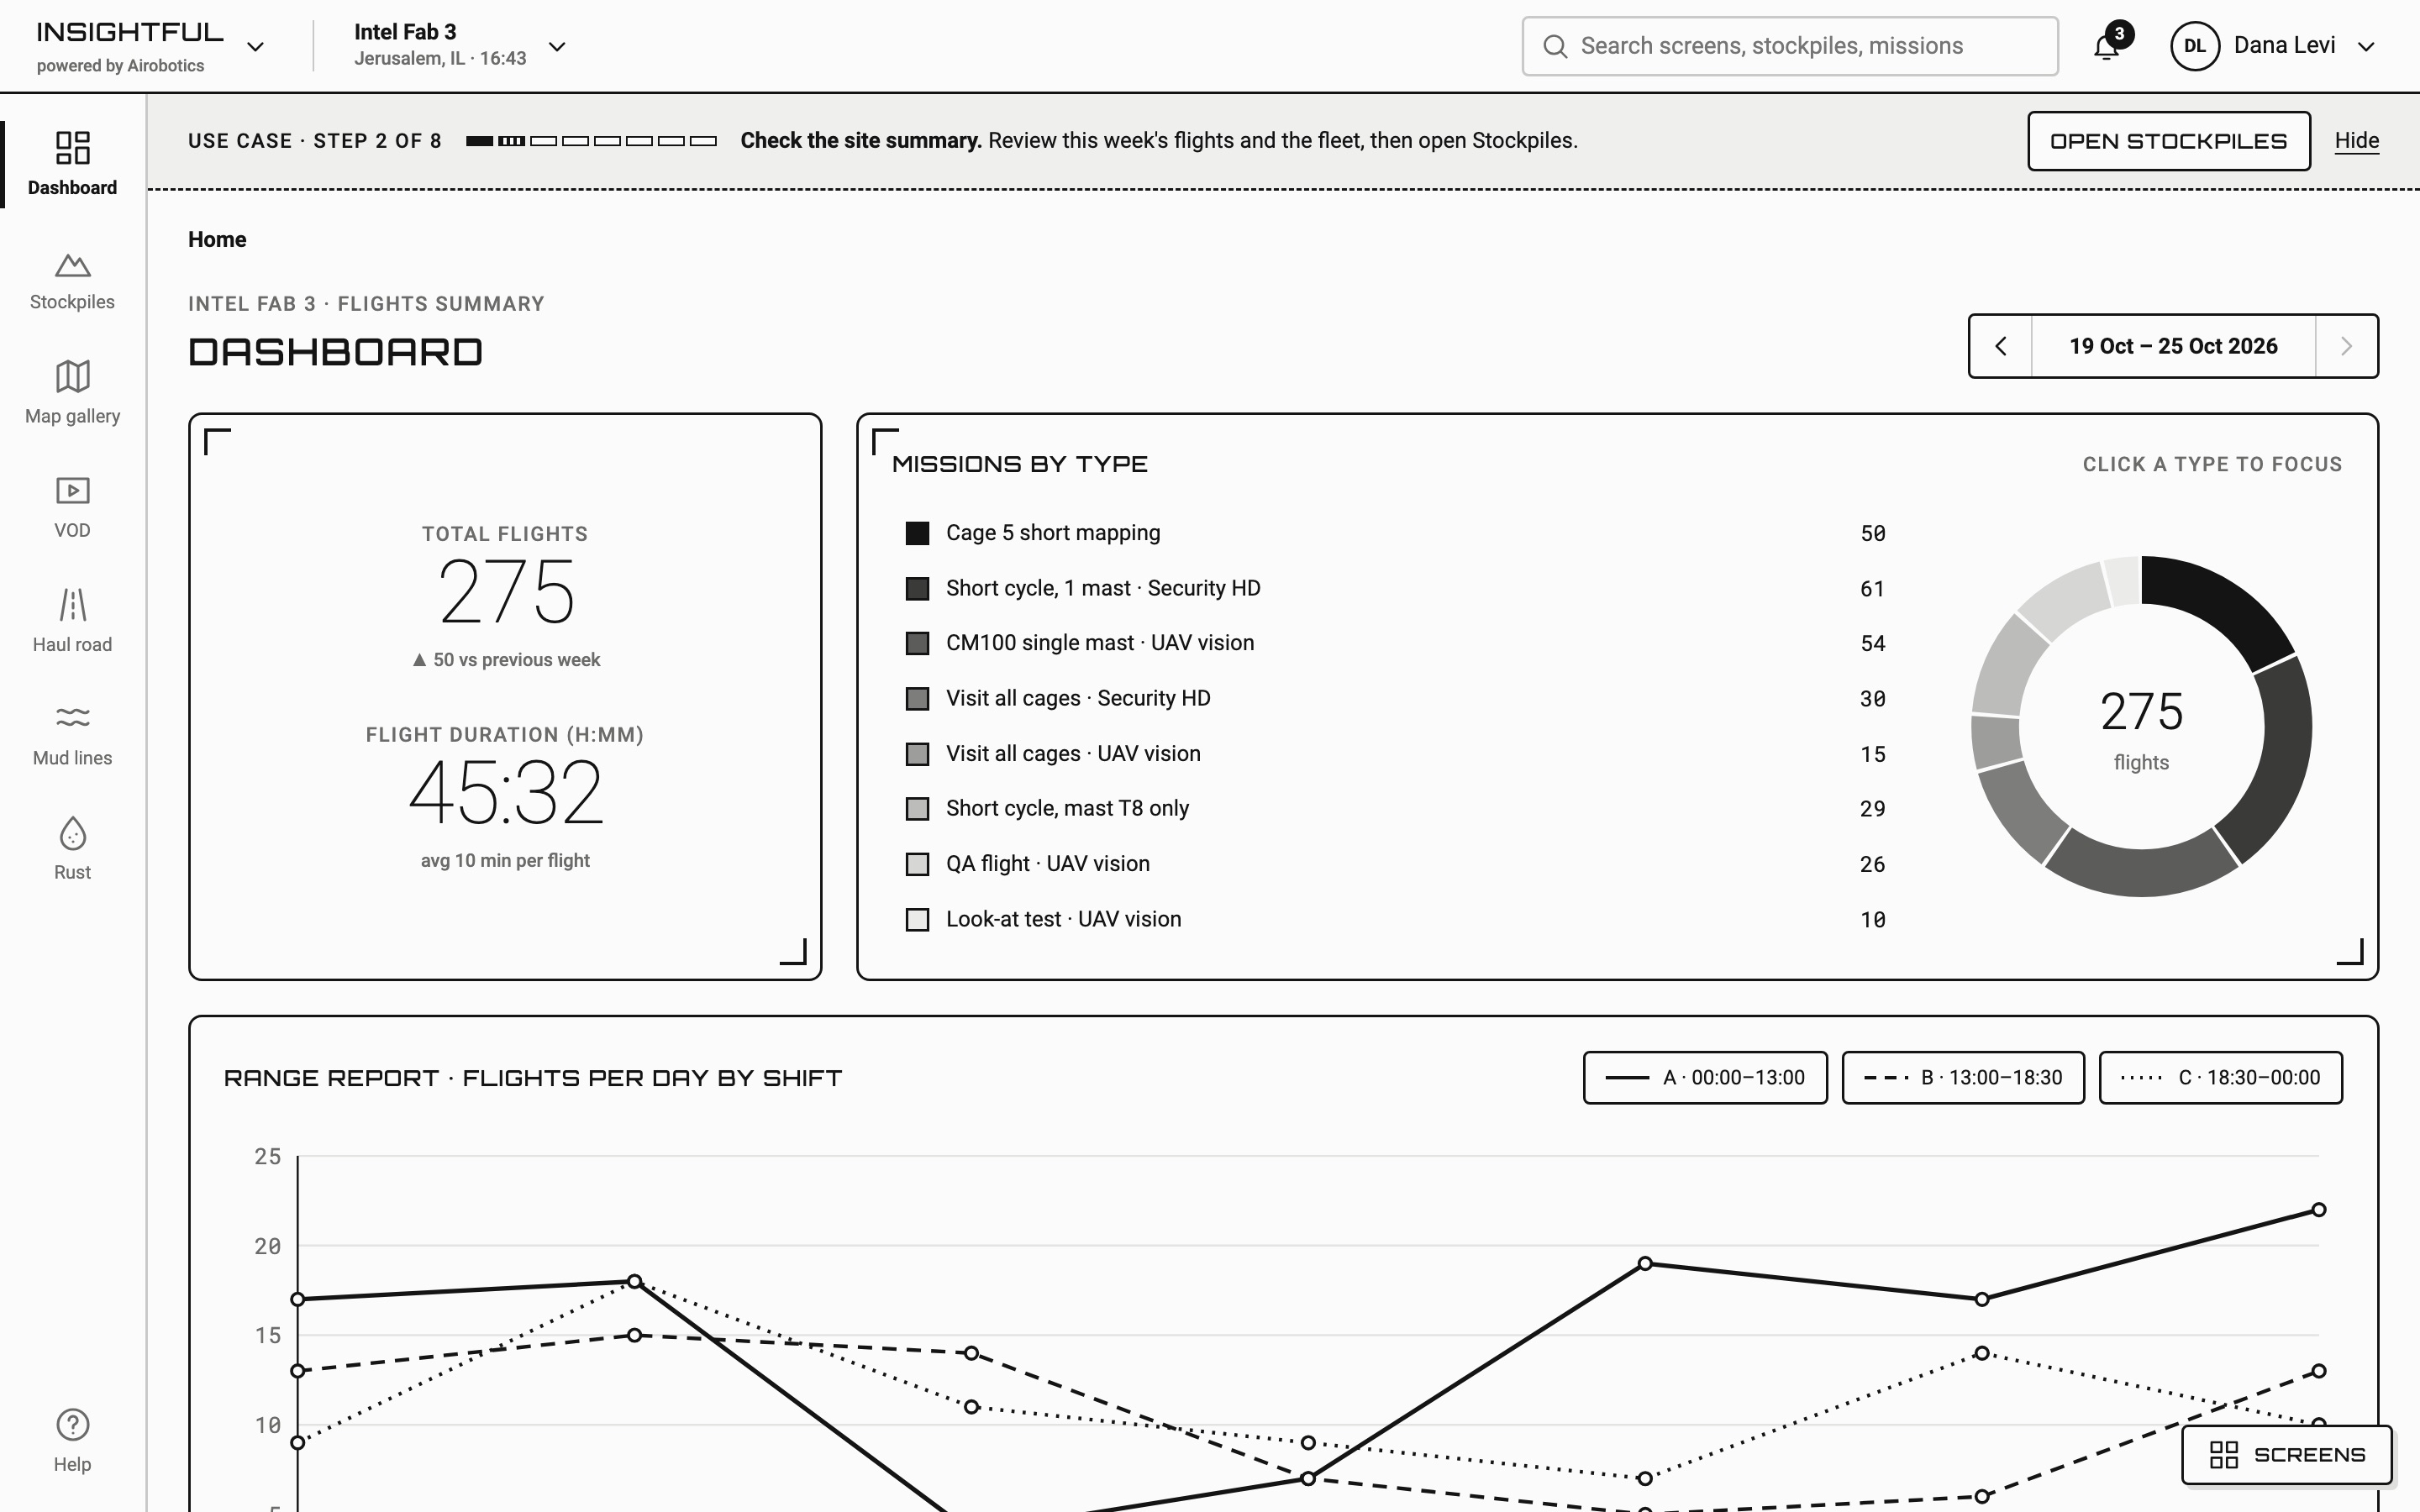
The grayscale wireframe settled the structure of the Insightful dashboard: flight totals, missions by type, and flights per day by shift. The final design kept that structure and added the dark product theme, colour for mission types and shifts, and the display type for titles and buttons.

Final Insightful dashboard in the dark product theme: total flights, missions by type with a donut chart, and flights per day by shift

Insightful dashboard. Drag to compare the wireframe with the final design.

Prototype

From the weekly summary to one flight\'s recording.

An operator signs in, focuses the dashboard on one mission type, reads stockpile volumes over time and on the map, then opens a flight's recording in VOD.

2016–2018 work, rebuilt in 2026 as a clickable prototype from the original Figma files. Sites, people and numbers are invented.

Insightful walkthrough. Open the prototype full screen ↗

Outcome

Insightful in production, on one shared language.

Insightful moved from a rough beta prototype to a production analytics platform, on the same design language as PRIMUS. Development moved faster because components, patterns, and handoff were no longer reinvented screen by screen.

The design system argument, won early, prevented the inconsistency that would have compounded as the product scaled. The most important outcome was not visual consistency alone. It was creating a system that helped the whole product team build with more confidence. The company was acquired by ONDAS Holdings in 2022.

2
Platforms shipped

PRIMUS (mission control) and Insightful (analytics), both in production.

1
Design system

Shared components and handoff standards the whole product team built against.

1→3
Team growth

Grew the design practice from a single designer to a team of three.

4
Countries served

Operations in Israel, Chile, Australia, and the USA.

Reflection

What three years at the edge of complexity taught me.

Leadership starts before the pixels. The most consequential design work in this project was not a screen. It was making the case for the design system before anyone believed it mattered. The quality of everything that followed depended on that argument being won first.

Systems thinking compounds. Winning the design system debate early prevented inconsistency from scaling with the product. What felt like extra effort at the start became the thing that made everything else move faster.