Headquarters
Reads across the force: budget execution, attrition and readiness by formation, to decide where attention and money go next.
Playscape · Client work · 2018
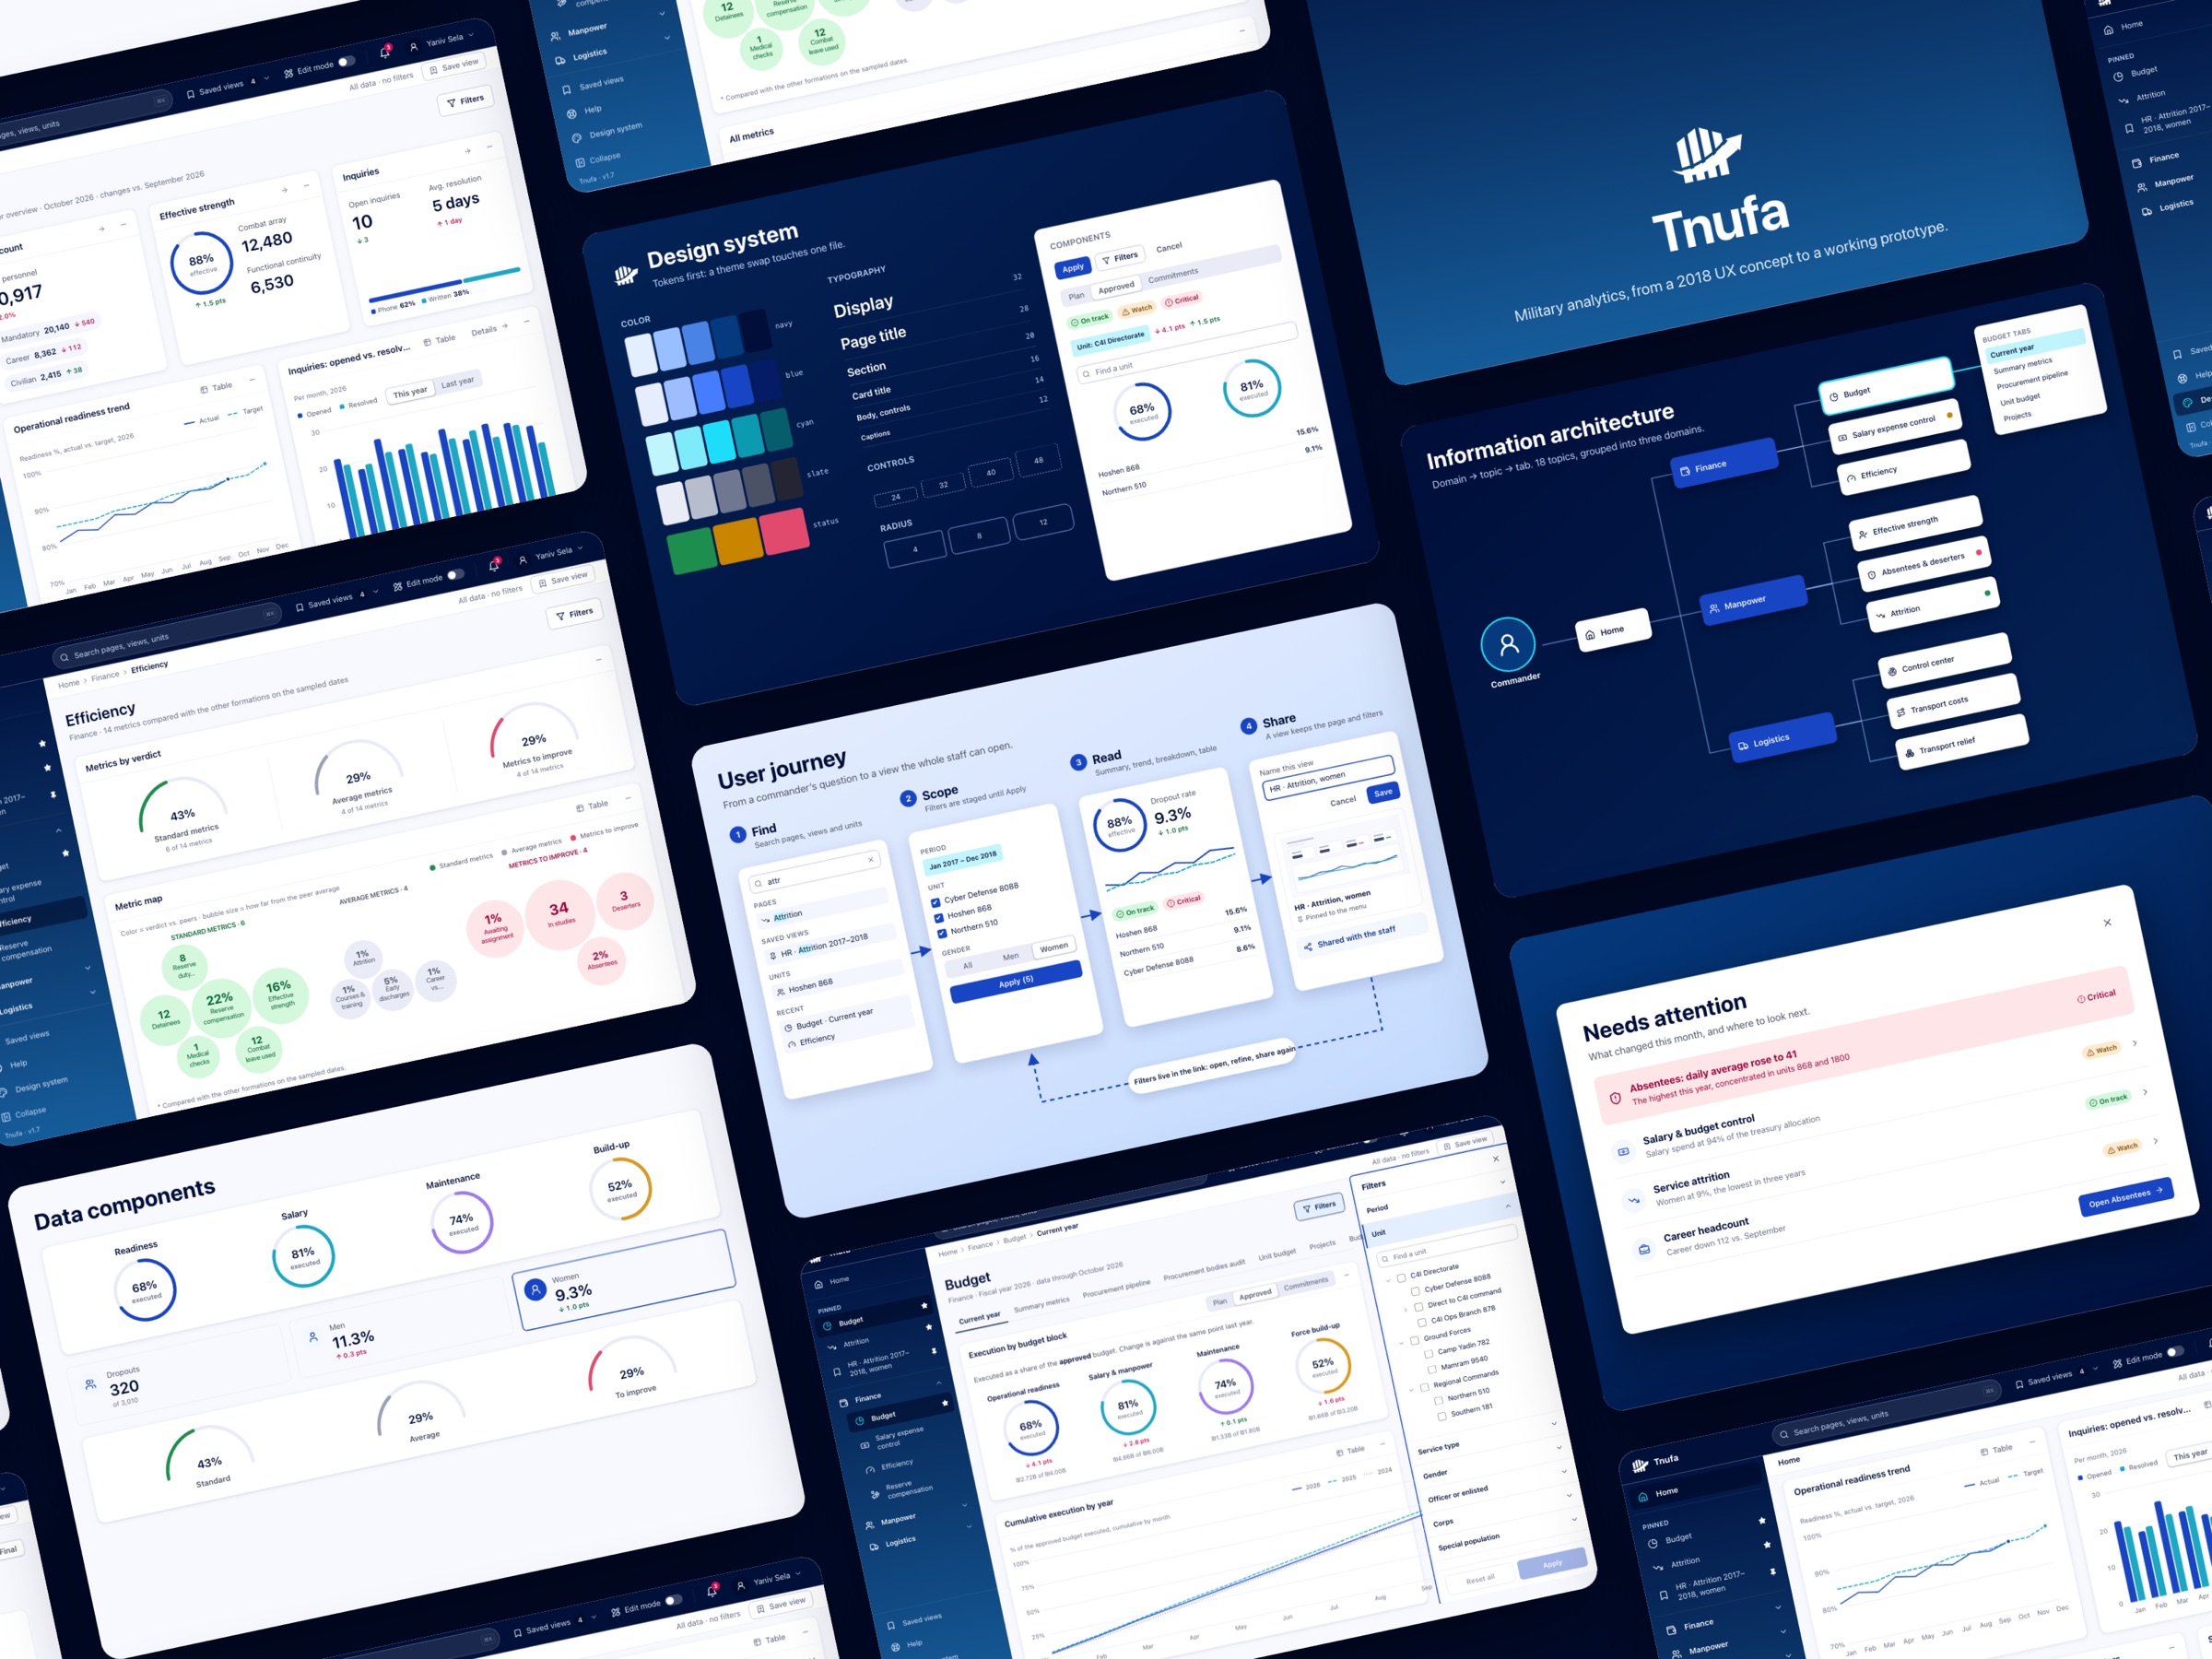
Tnufa is a resources platform for the Israel Defense Forces: finance, manpower, and logistics in one web view. I turned a 19-item menu and a user research review into a product where a filtered view can be saved, shared and opened again.
Three domains. One way to keep a view.
Context
Playscape was asked to shape Tnufa for an IDF client. Headquarters needed a budget view. Field commanders, down to unit captains in a division of thousands, needed the same finance, manpower, and logistics numbers. The June 2018 review named the job: make the information, the conclusion, and the lesson reachable from the system.
This was client delivery in the same years I was building the Playscape practice.
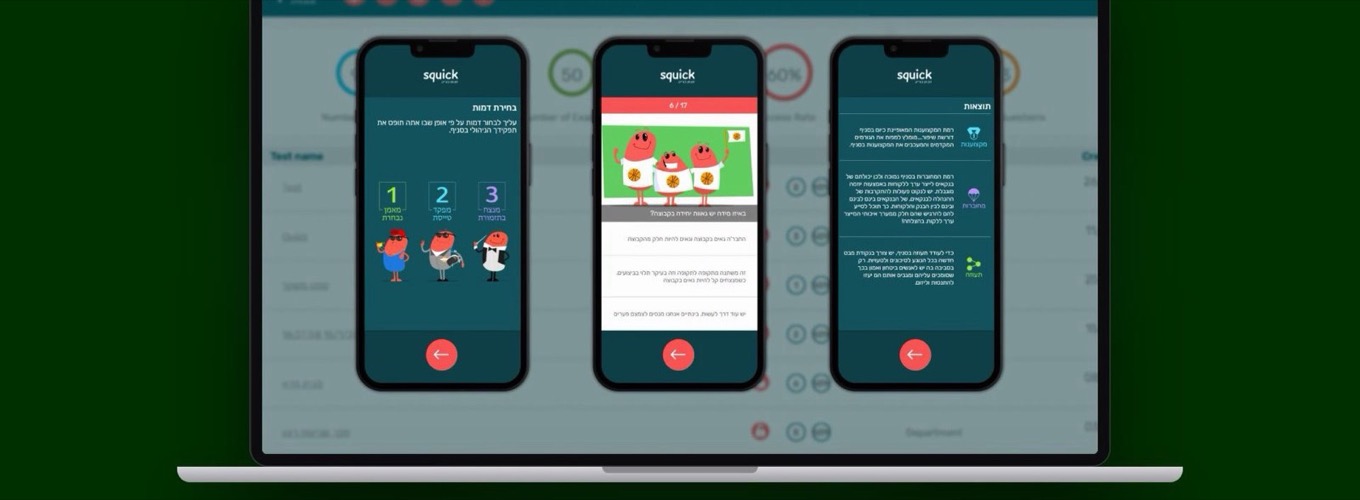
Original unit screen, 2018. Hebrew, right to left. Primary ratios first, the table as support.
Users
Both readers asked the same kind of question, at different scale: where is a unit against its budget, its people, its logistics, and what changed. Both came back to it every week.
Reads across the force: budget execution, attrition and readiness by formation, to decide where attention and money go next.
Read their own unit, down to unit captains: the same measures, filtered to one unit and one period, kept for the next meeting.
Web only, inside the IDF network, at 4:3 and in Hebrew. Different permissions for different readers. Mobile was out of scope.
What the review found
12 June 2018. Version 1.0 of the user research. Until the system was in place, people ran research and reports in Excel. The web tool could draw charts. It could not hold a personal view, a summary that supported the numbers, a clear order on the page, or a filter that ended in a conclusion. Every return visit started from zero.
There was no personalization. A commander who had filtered to a unit and a year had to rebuild that query the next time they opened the system.
Primary numbers and supporting charts sat at the same visual weight. The screen did not tell you what to read first.
Each chart carried its own filters. Nothing collected them into one place, so the page never became a single conclusion.
Finance, manpower, and logistics were a long stack of screens. Depth was there. A way to see it was not.
User journey
The journey has four steps: find, scope, read, share. Filters are staged until Apply, and the result lives in the link, so a view can be opened, refined and shared again without being described in a spreadsheet.
User journey. A commander’s question becomes a saved, shared view.
Key decision
The data was not the gap. Headquarters and the field already had more of it than a person could reassemble by hand. Another graph would have made the next visit longer, not shorter.
The default
Add more charts and a longer menu, and leave each screen to carry its own filters.
The decision
Group the menu, let a commander save a filter set, put every active filter in one breadcrumb, and order the page so the primary numbers come first.
Information architecture. Domain, topic, tab. Never more than three levels.
Process
Read the review
I started from the June 2018 research: what commanders did in Excel, and what the web tool could not hold.
Regroup the menu
The 19 items became topics under three domains, with sub-groups as captions, not another click level. Nothing was dropped.
A grayscale shell
The first build was a wireframe with no color: navigation, filtering and moving between pages had to work before anything looked finished.
Brand and system
Then the navy shell, the design tokens and the data components, so every page could be built from the same parts.
Navigation review, 12 June 2018. Domains first. Topics only after the domain is open.
Wireframes
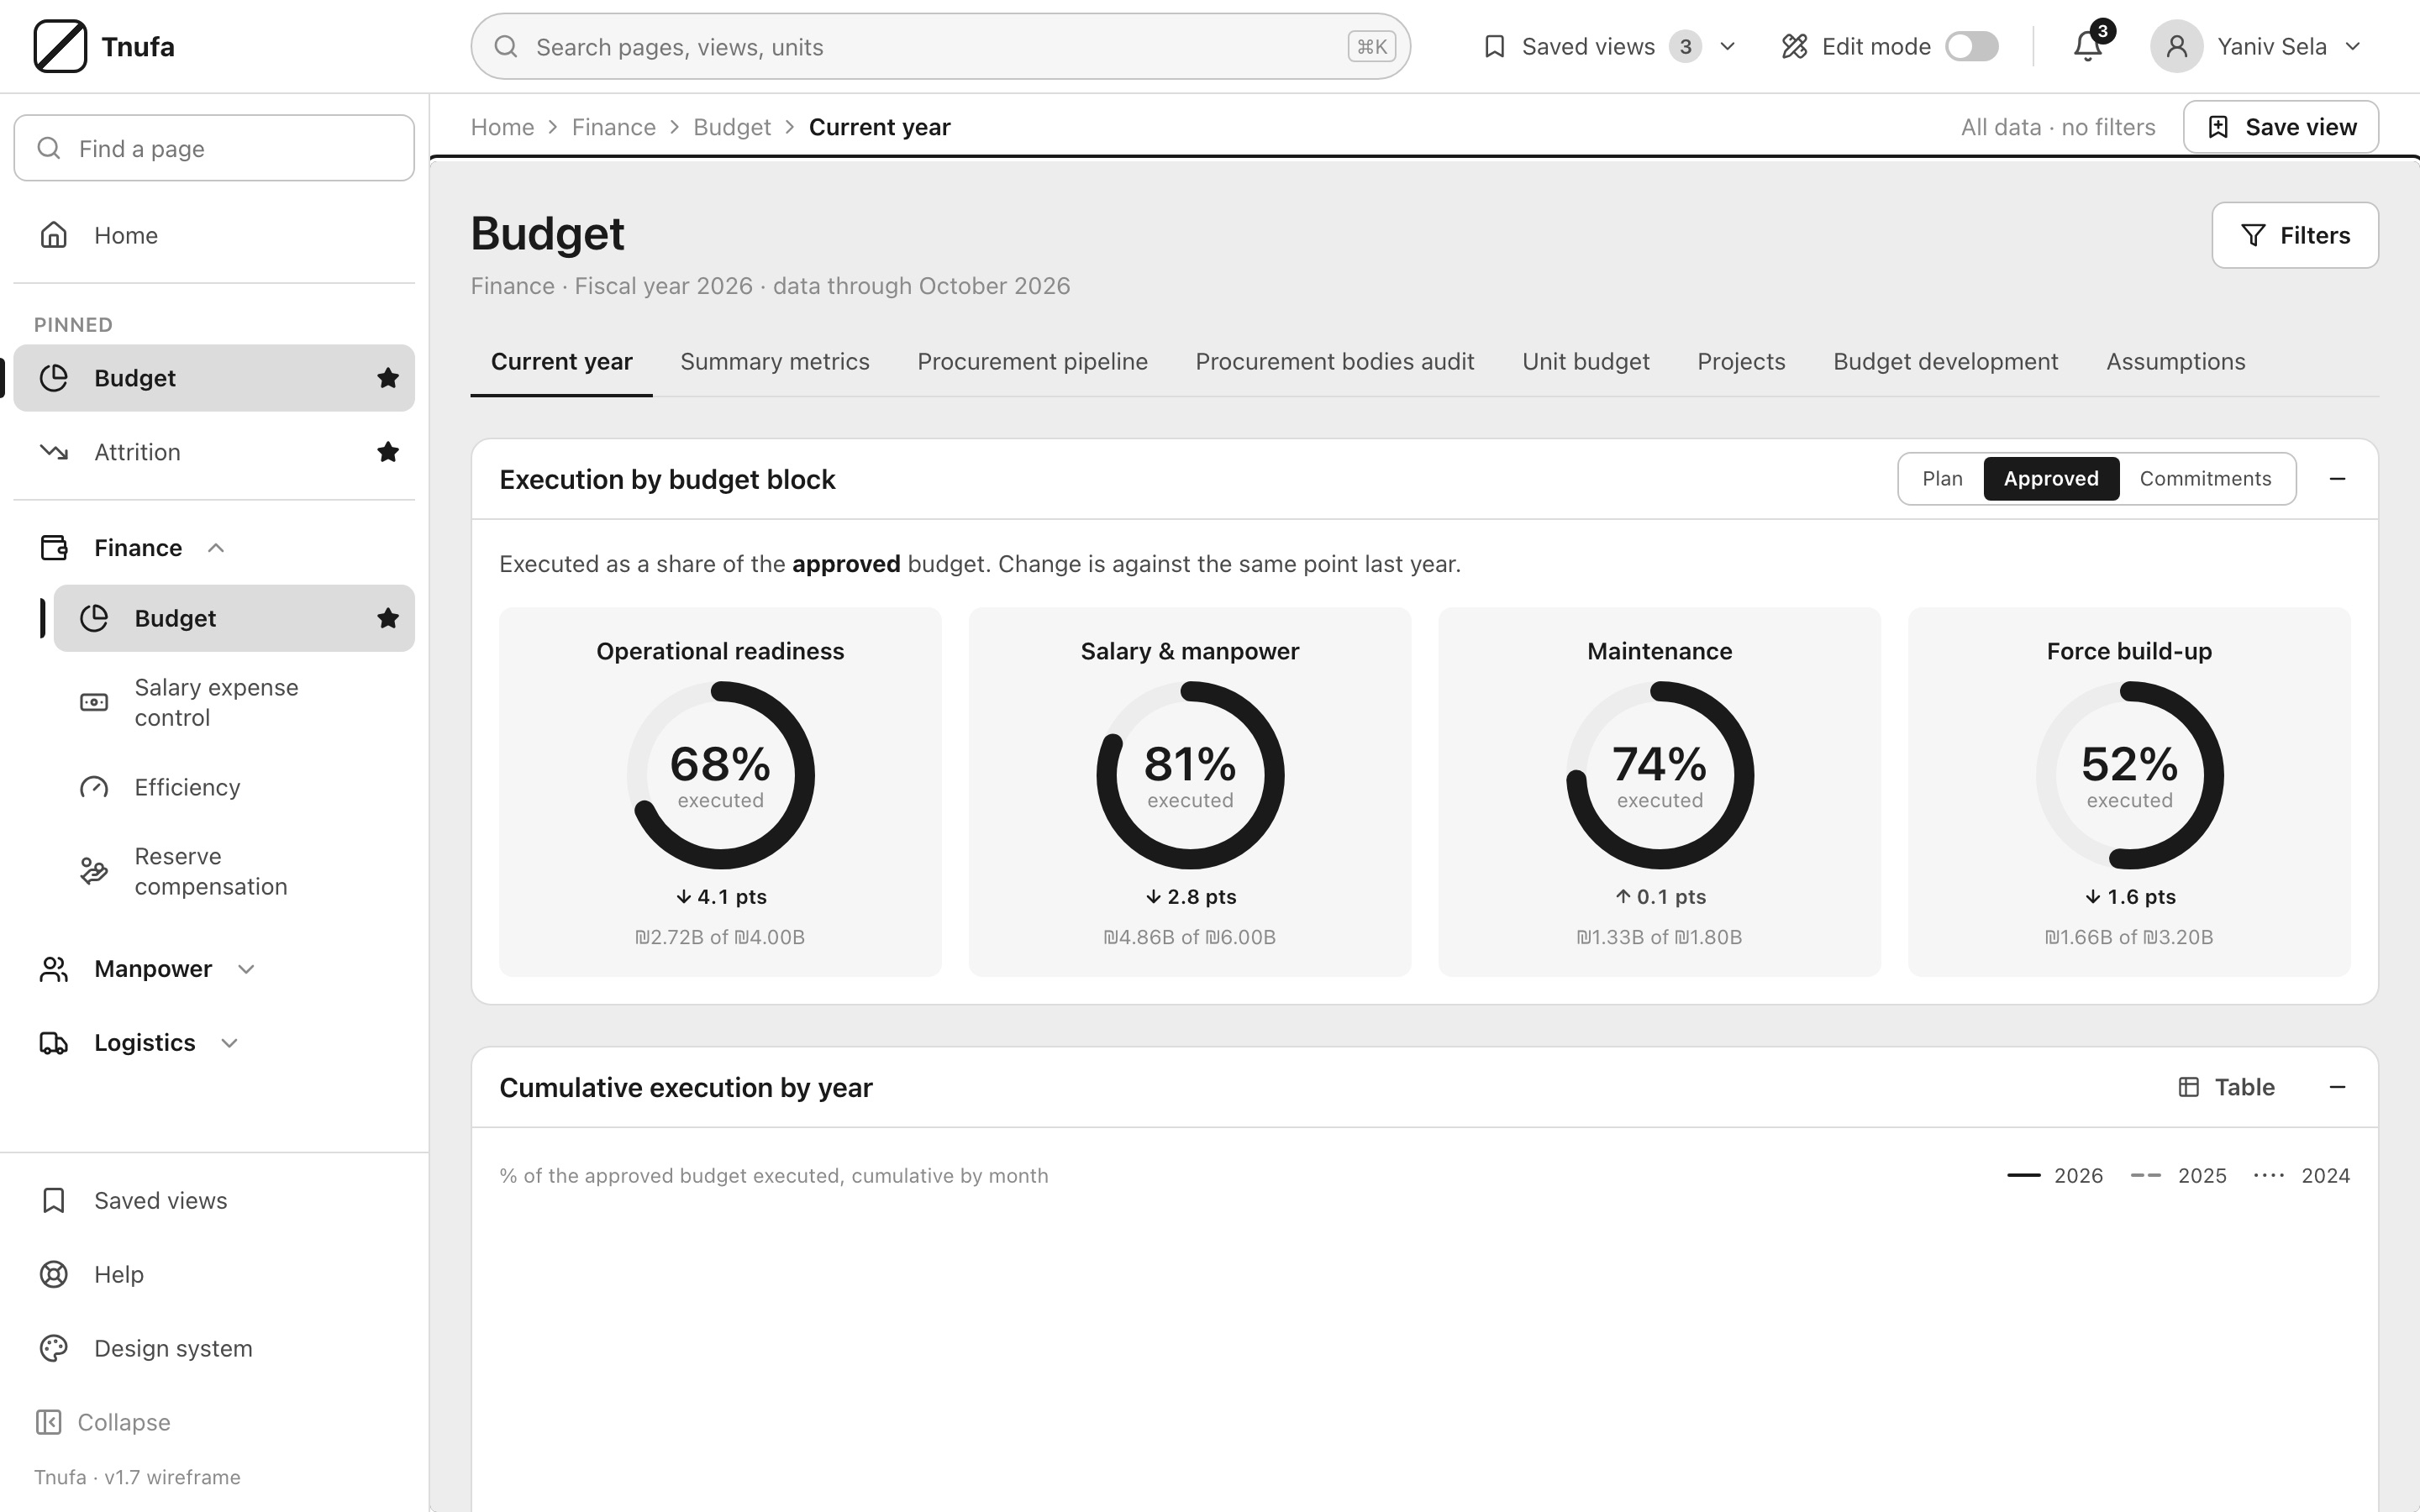
The grayscale shell settled the structure of a topic page: breadcrumb and active filters on top, tabs for lenses, the primary measures first and the trend below. The final design kept that order and added the brand, status color for values that need attention, and the pinned views in the menu.
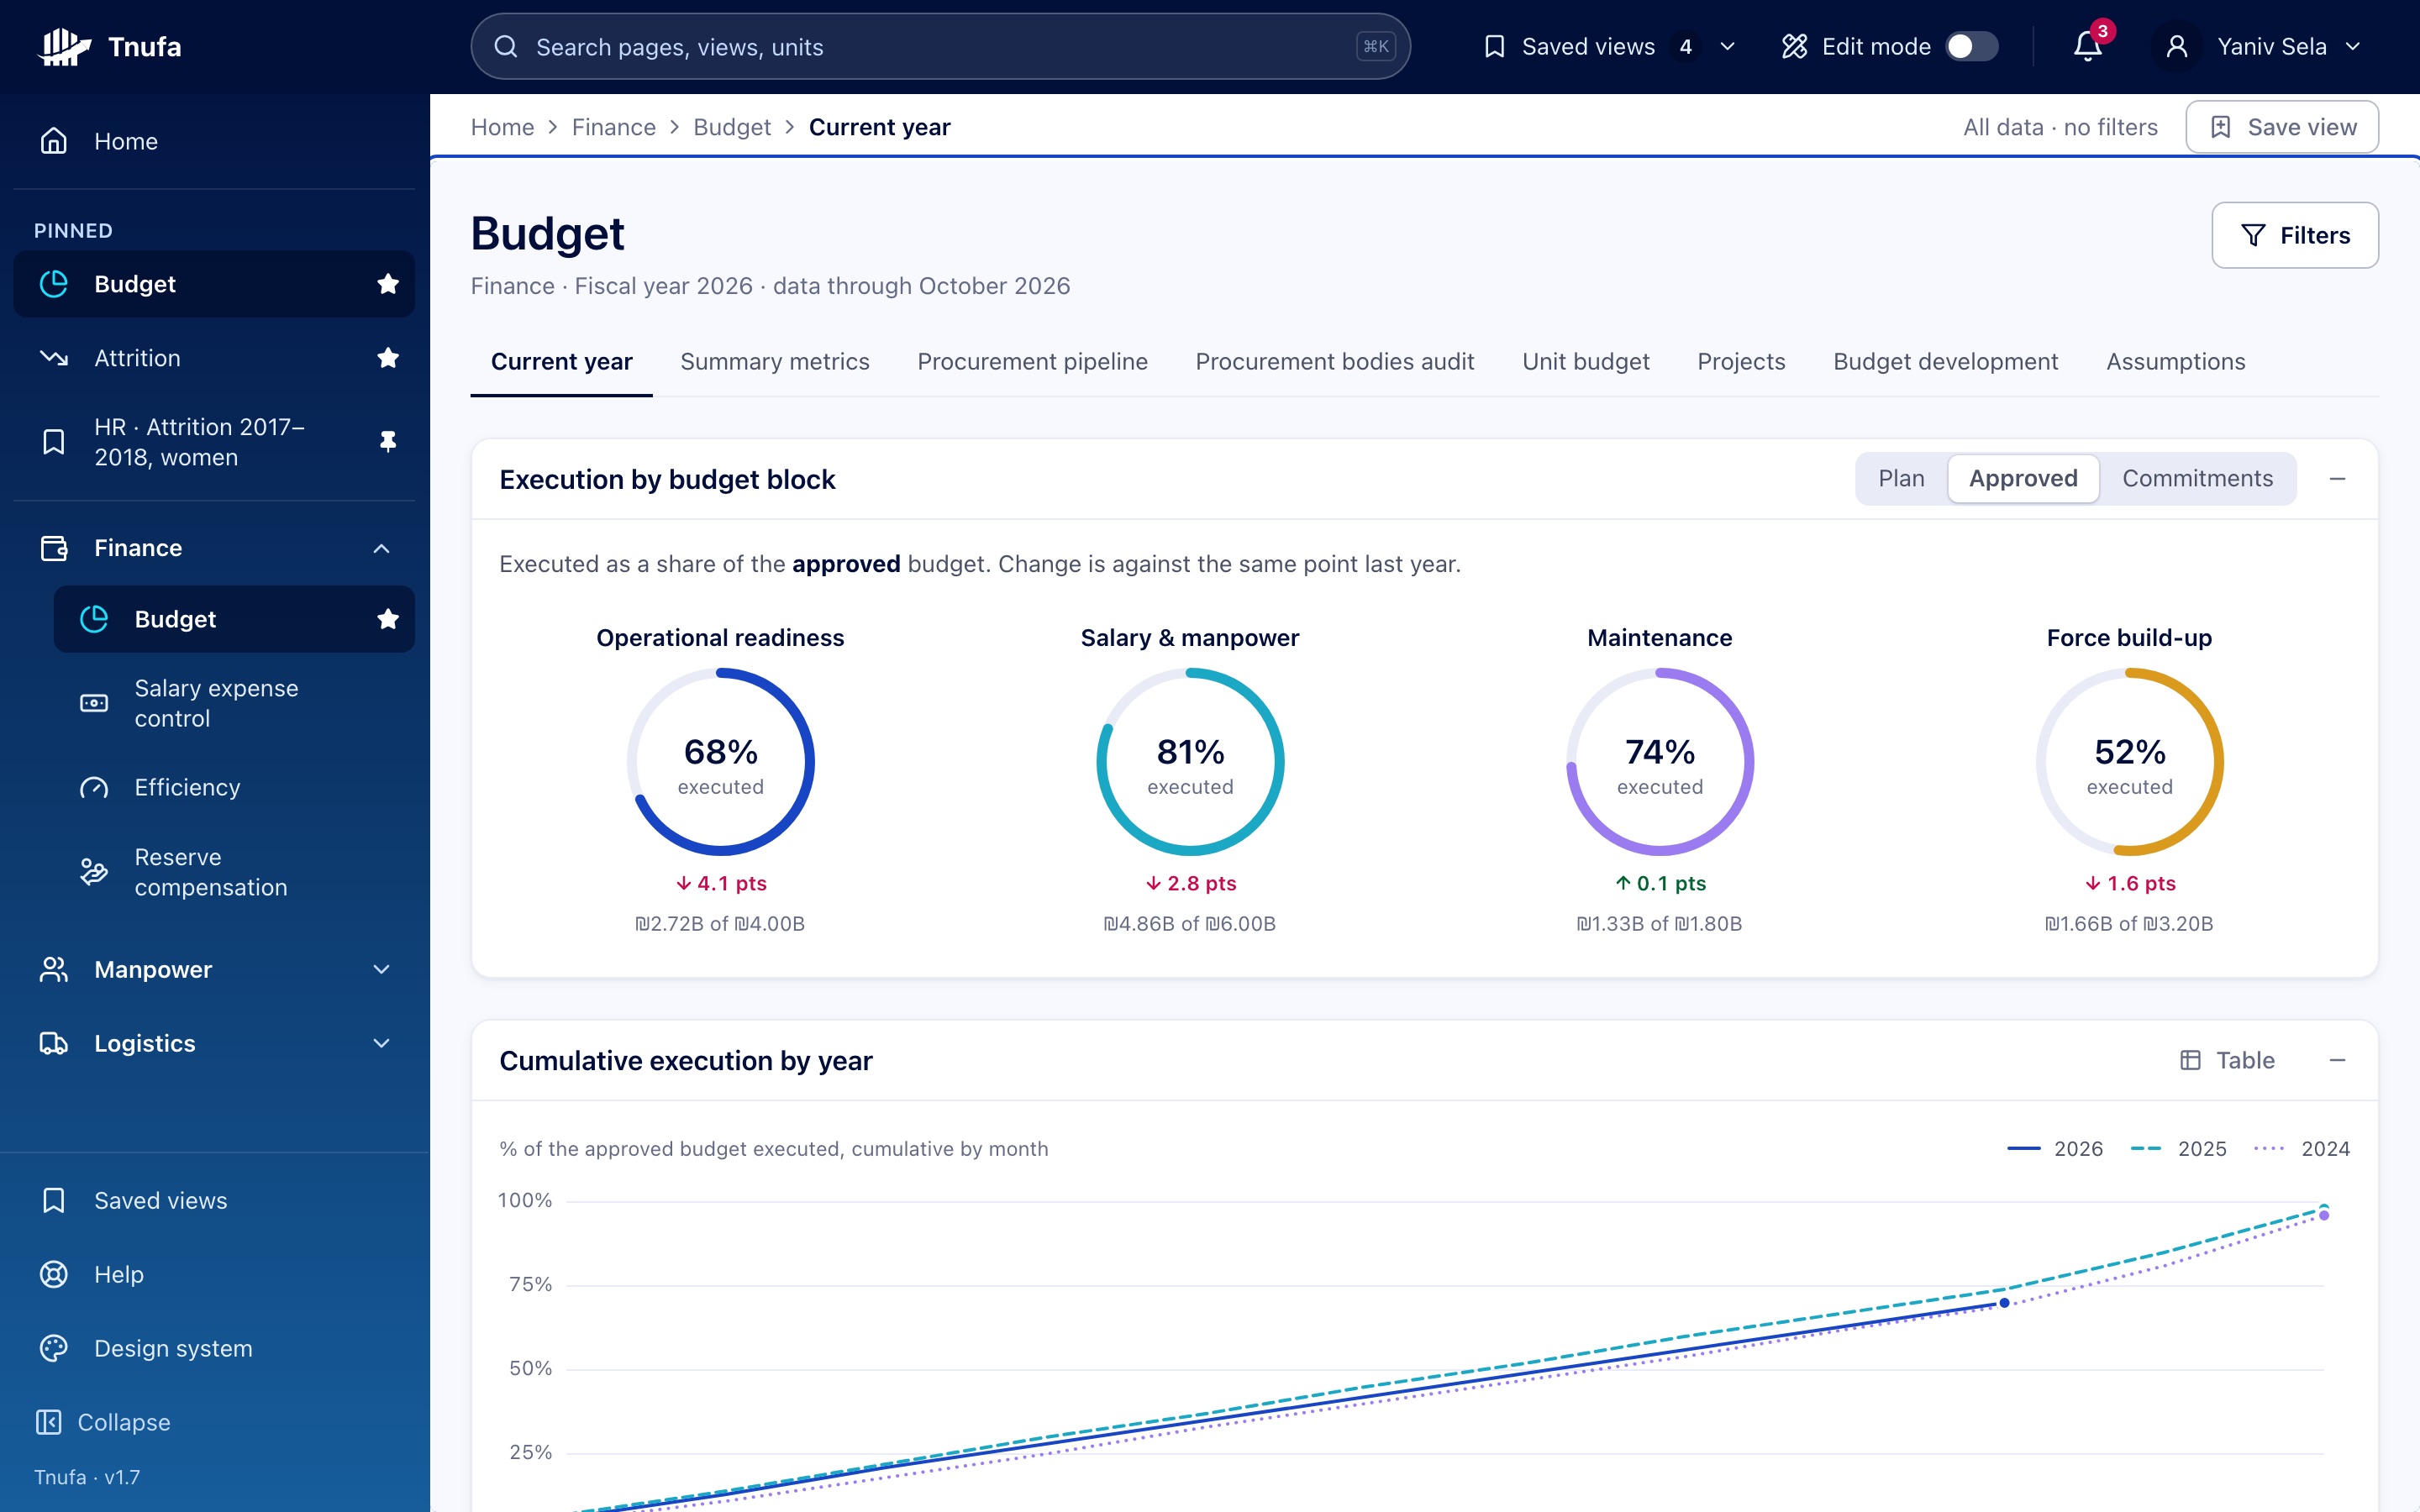
Budget, current year. Drag to compare the grayscale shell with the final design.
The solution
Views you can keep
Save view stores the page, its tab and the active filters. Saved views can be pinned to the menu and shared with the staff, so a conclusion survives the next login.
One filter panel, shown as chips
All filters live in one panel and are staged until Apply. The active ones sit as chips next to the breadcrumb, with Clear all, so the page always says what data it shows.
Primary numbers first
Each page opens with the measures that answer the question, then the trend, then the breakdown and the table. Status color is kept for values that need attention.
One search for everything
Search finds pages, saved views and units from one field, so depth in the menu never blocks a quick answer.
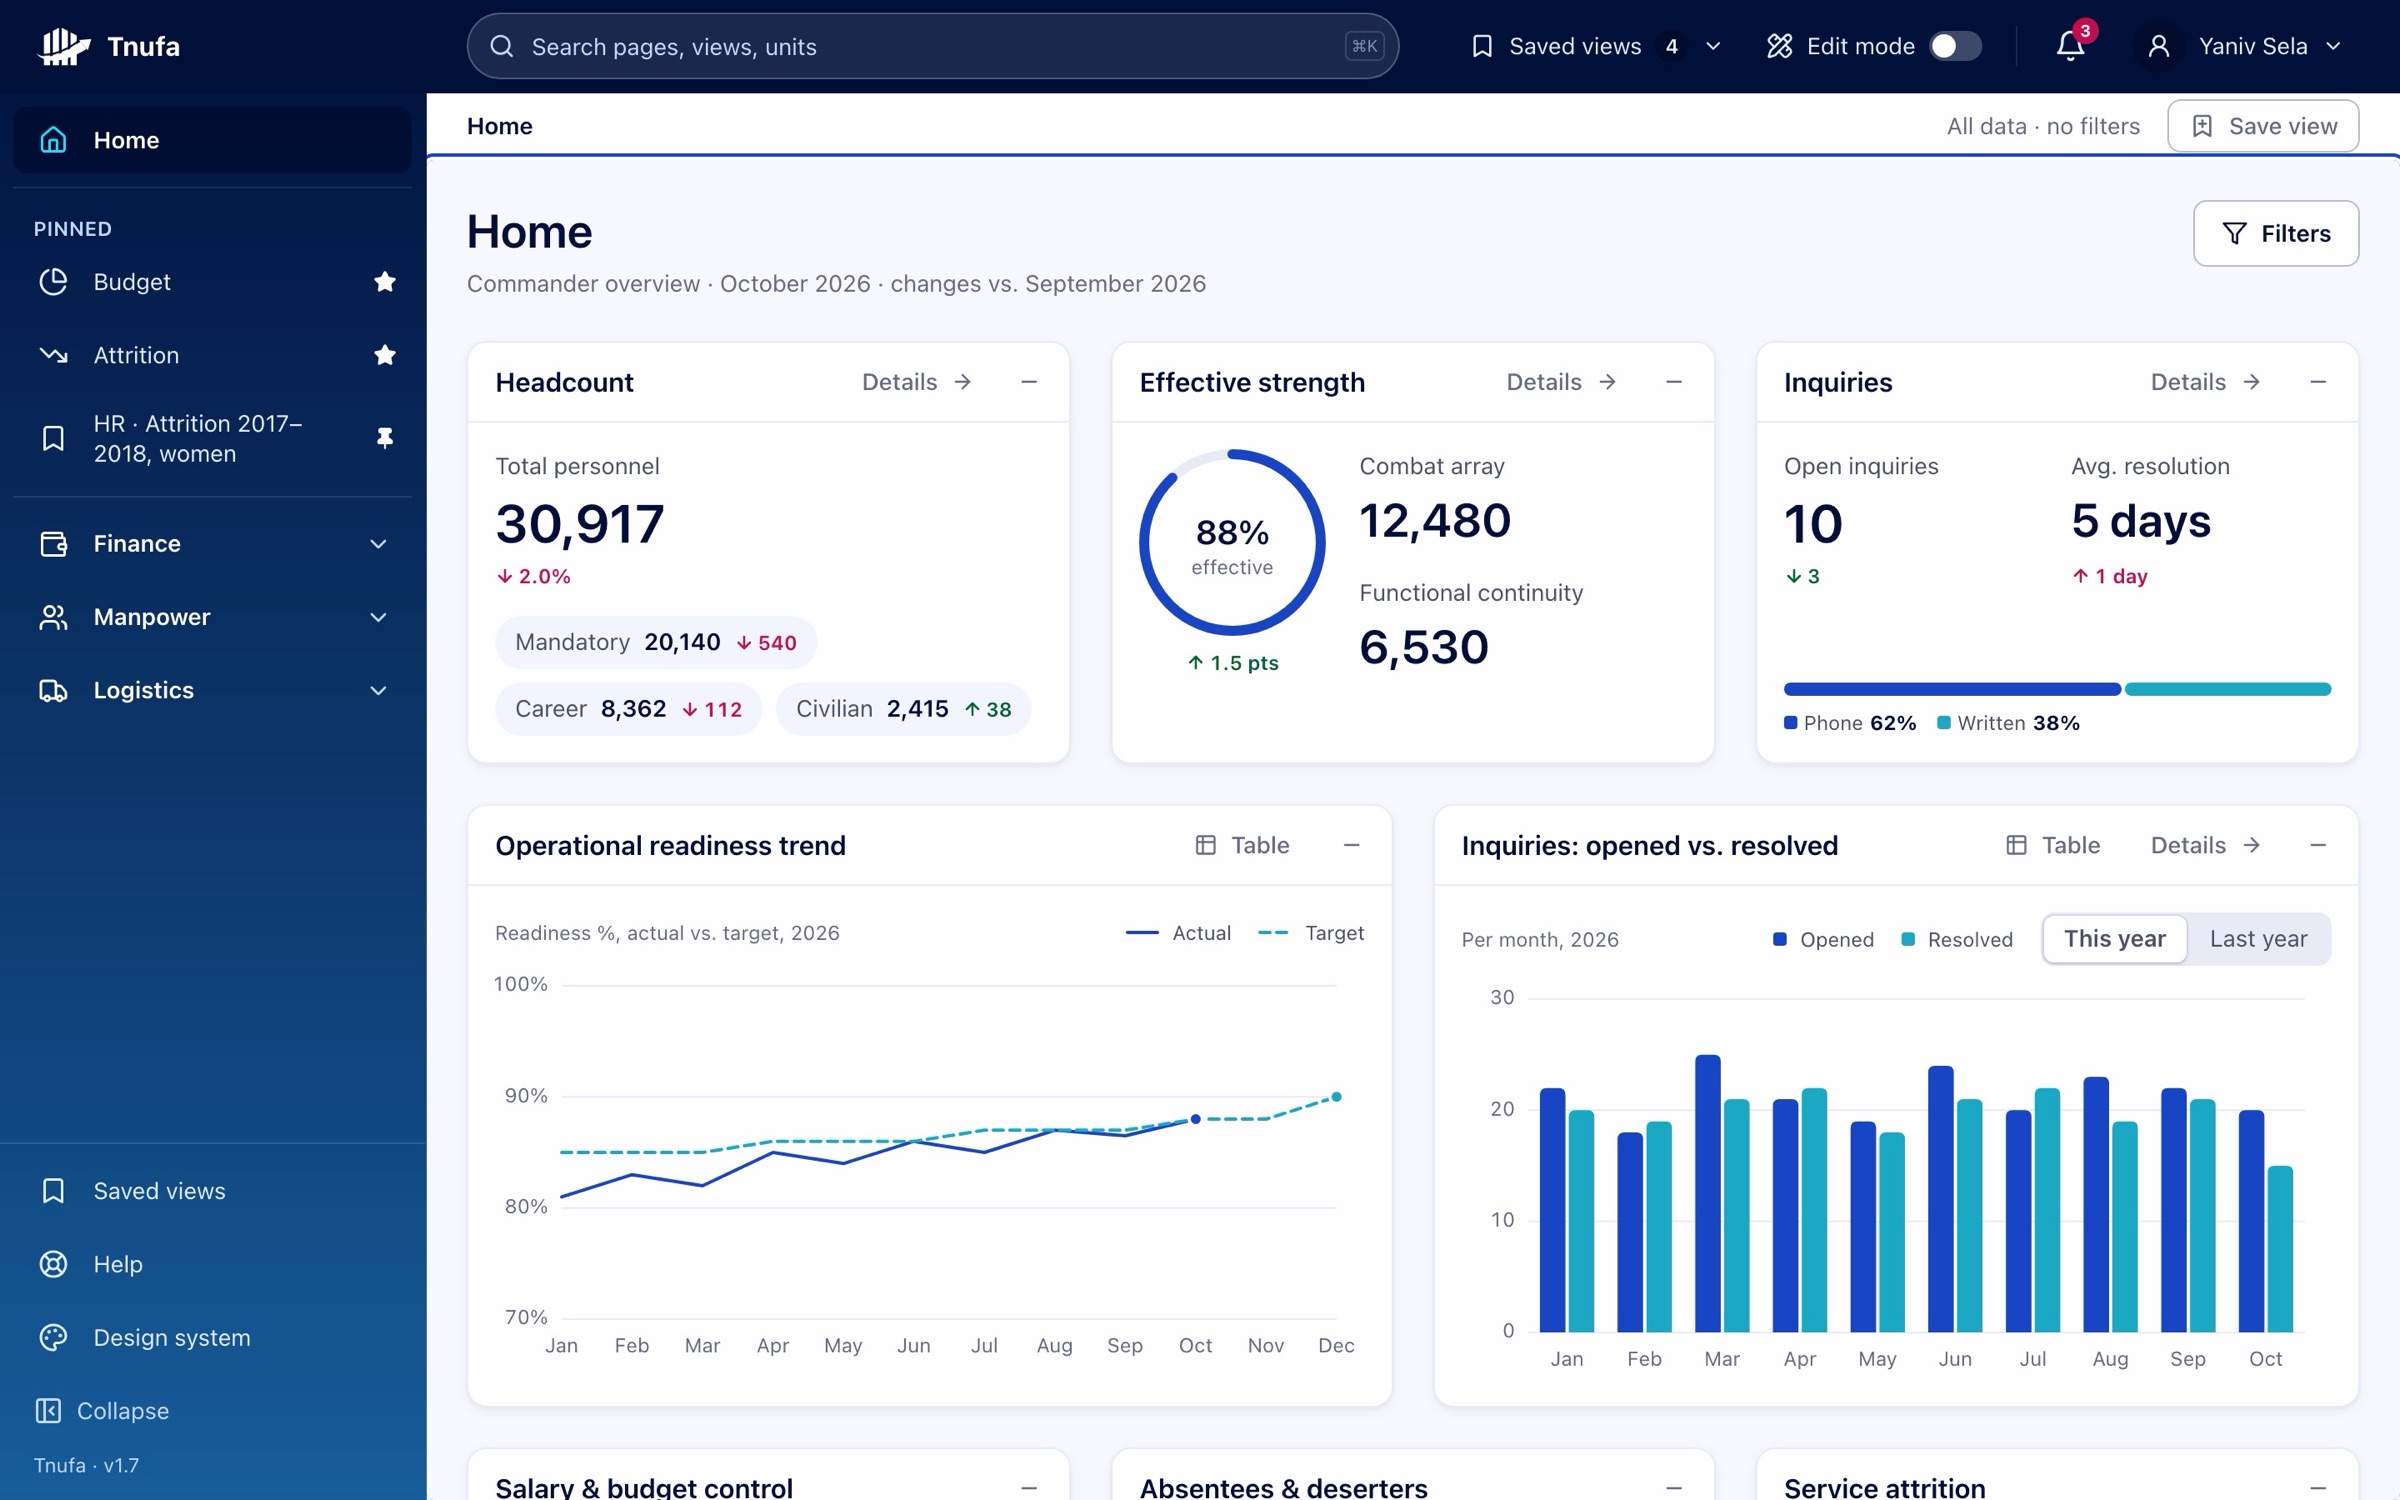
Home. The commander’s overview.
Attrition. Filters as chips, women selected.
Efficiency. Verdict first, then the map.
Prototype
One question, end to end: search for attrition, filter to two units and to women, apply, and save the view. Try the prototype to click through it yourself.
Rebuilt in 2026 from the 2018 research, structure and screens. Units, names and numbers are invented.
Reflection
If the view disappears when the tab closes, the analysis was never in the product. Headquarters and the field were already capable of reading a chart. What they could not do was leave a filtered unit, a year, and a judgment in the system and trust it would still be there. That is the part of Tnufa I still use when a dashboard looks finished and the work is not.