Scan the company
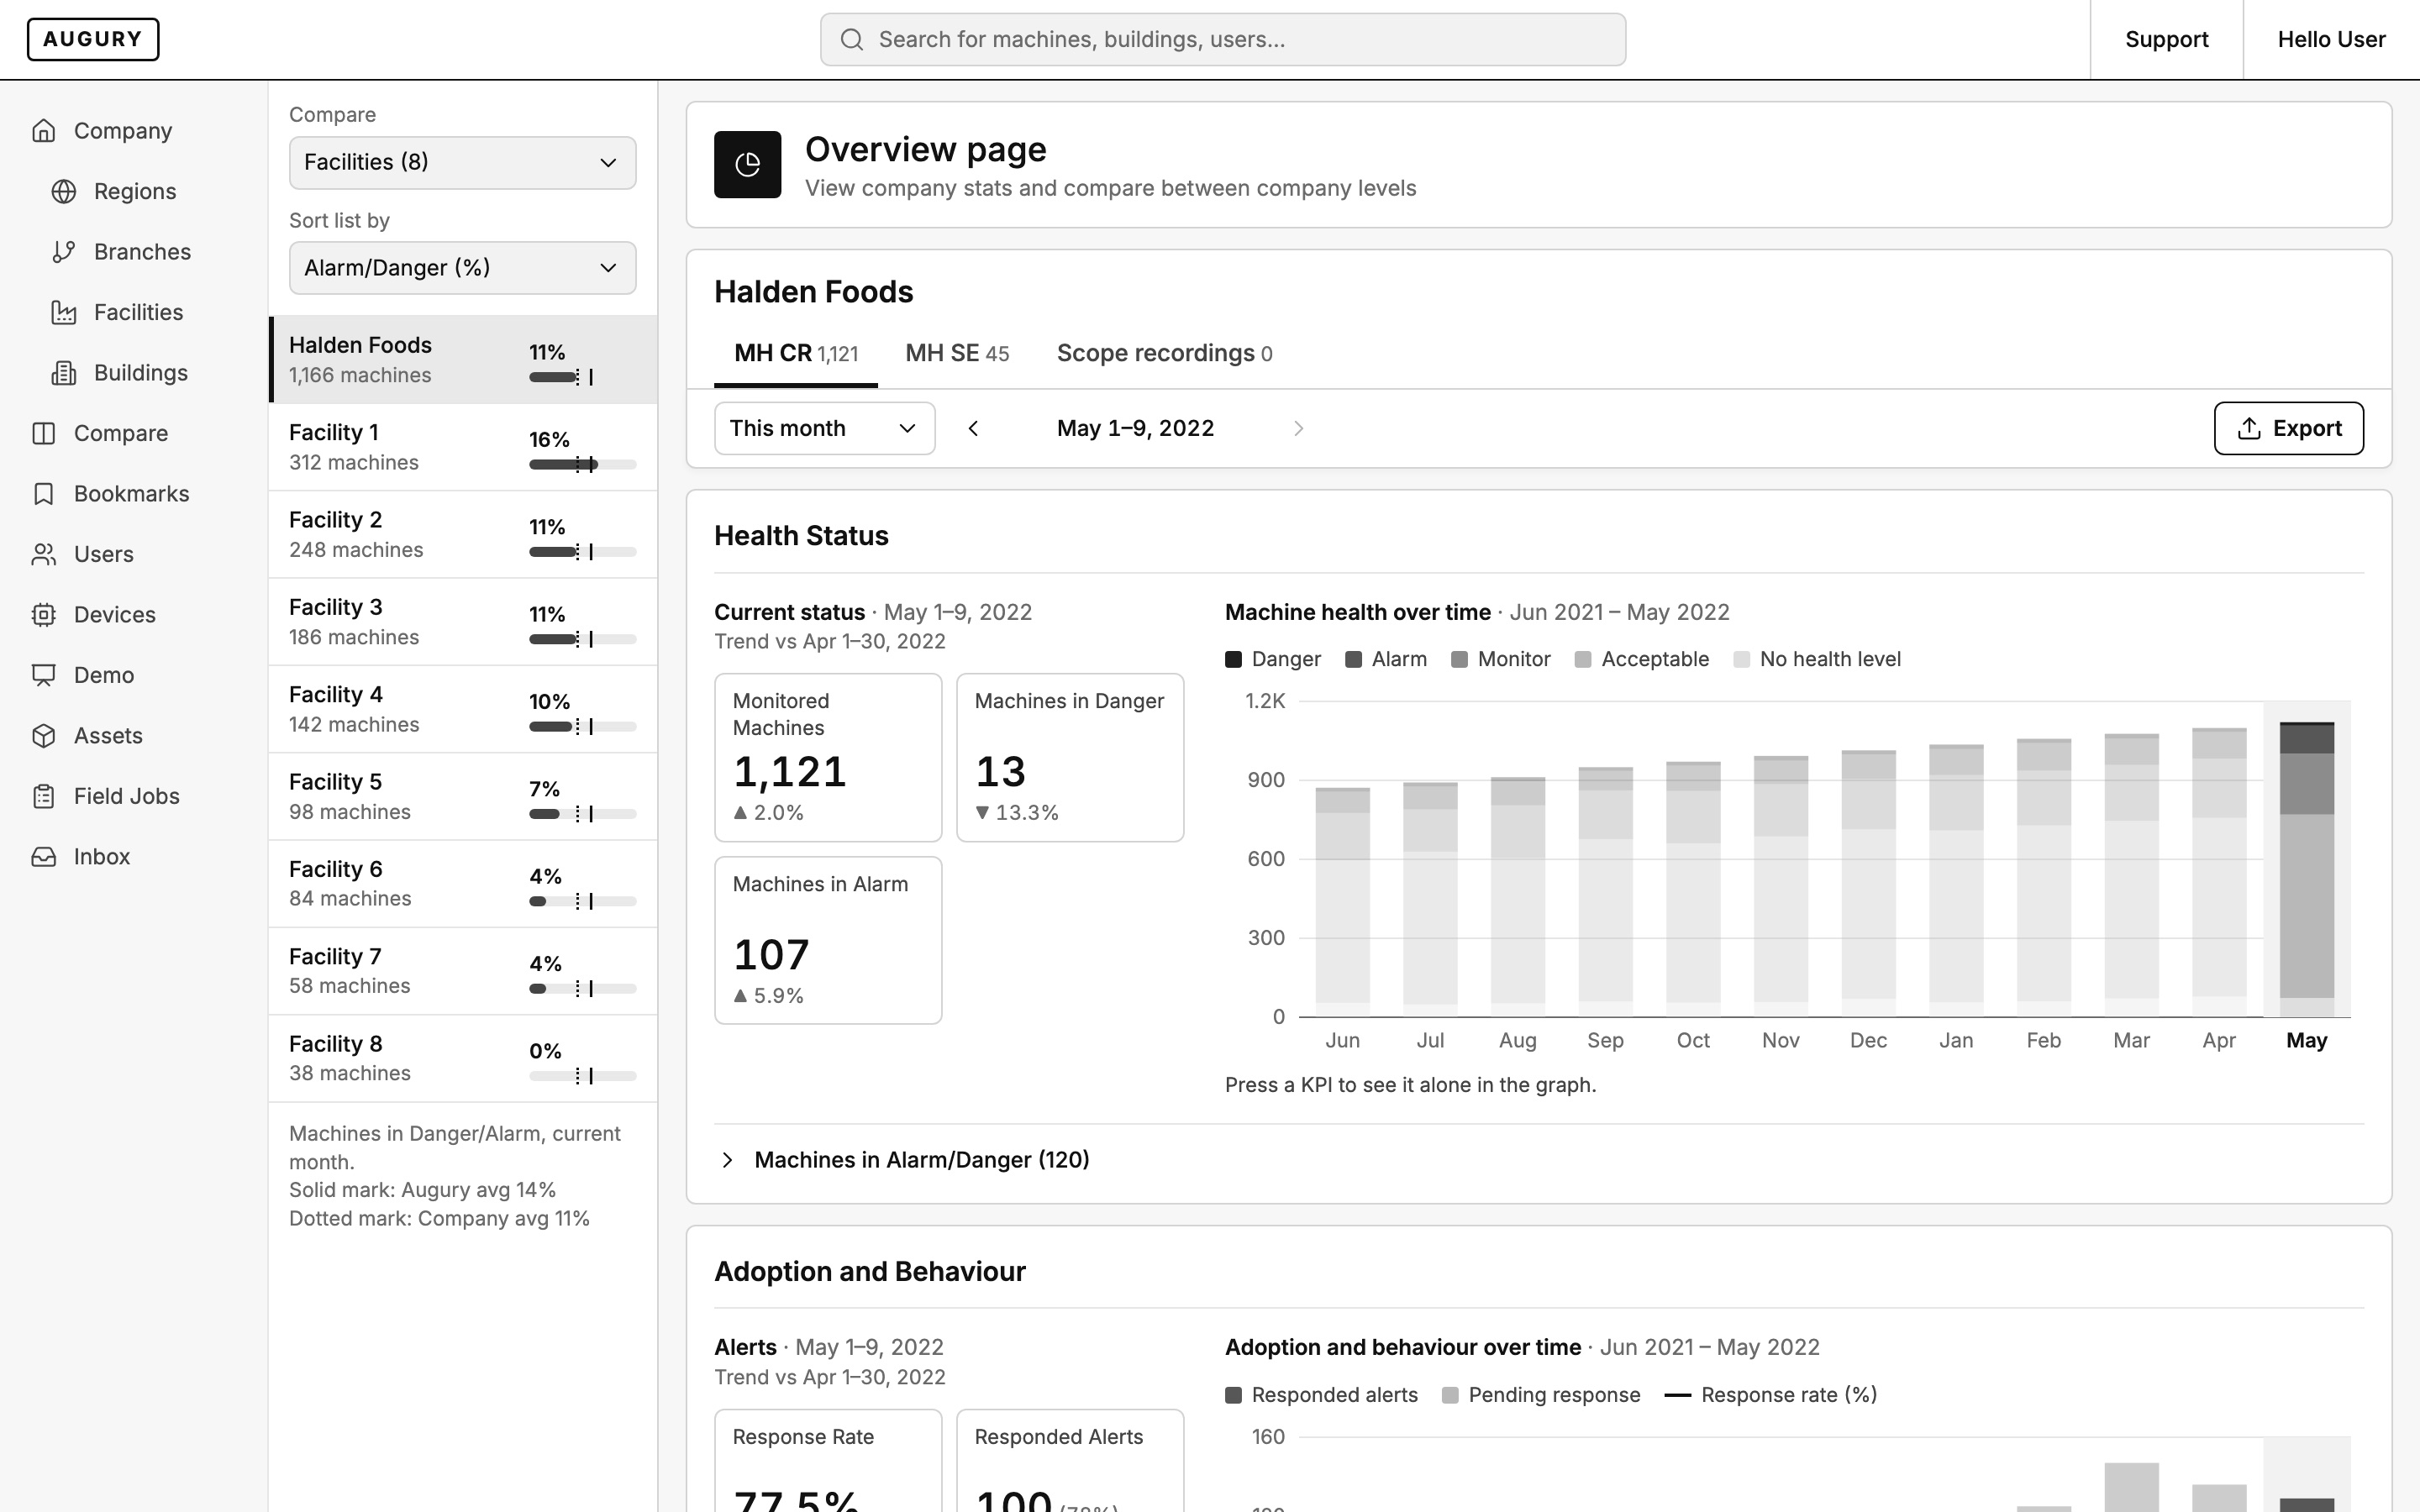
How healthy are we right now, and is it better or worse than last period? The answer has to be readable before anything is pressed.
Augury · Machine health
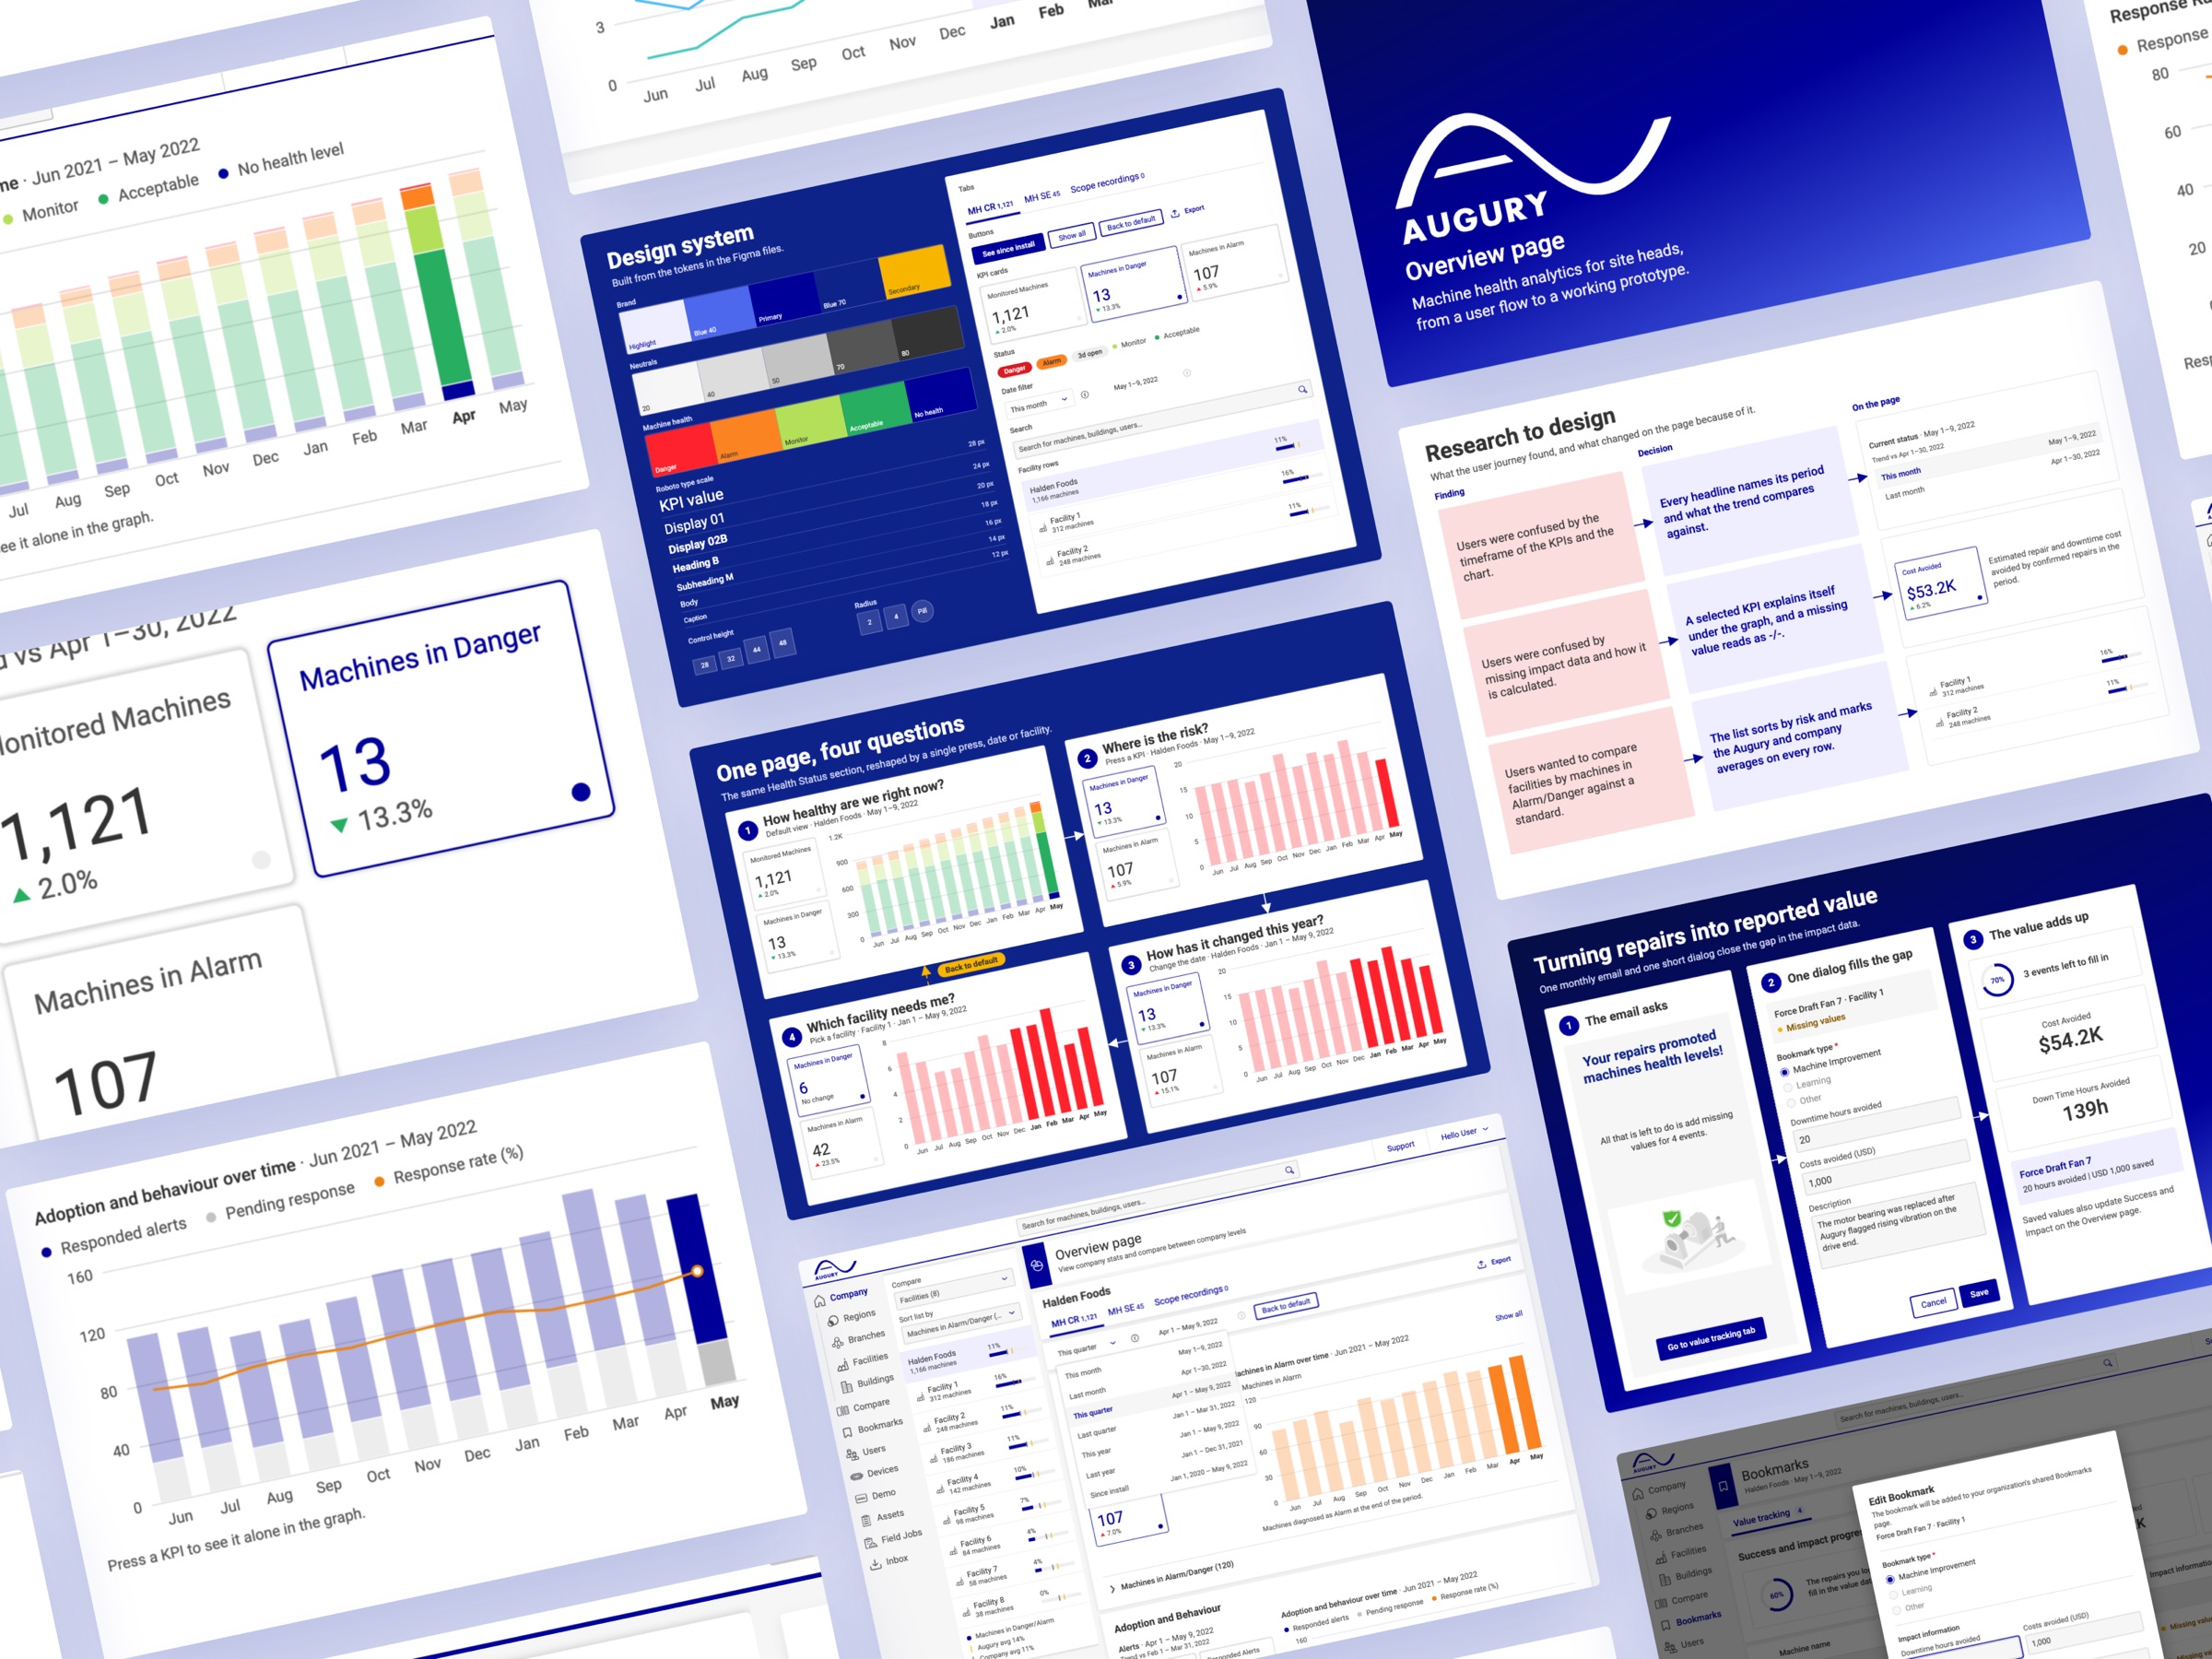
Augury monitors the health of industrial machines. I redesigned the Overview page so a site head can see how healthy the company is, where the risk is, how it changed, and which facility needs them, all driven by one filter.
One page. Four questions. One filter.
Context
Augury puts sensors on industrial machines and diagnoses their health: Danger, Alarm, Monitor, Acceptable. The Overview page is where a customer lands: company stats, and a way to compare regions, branches, facilities and buildings.
The brief was to retrieve data. The product needed two modes on the same page: one for scanning the whole company at a glance, and one for investigating a single metric, period or facility.
Users
The page is built for the person who answers for a plant or a group of plants. They come in to check, not to explore, and they need to leave with a decision about where to look next.
How healthy are we right now, and is it better or worse than last period? The answer has to be readable before anything is pressed.
Which facility needs me? Facilities ranked by machines in Alarm or Danger, against a standard they can trust.
What did the repairs save? Cost and downtime avoided have to be filled in and counted, or the impact data stays empty.
Research
The product manager I worked with ran the user research. She shared the recordings with me, and we analyzed them together. Each finding became one decision, and each decision has a place on the page.
Research to design. What the user research found, and what changed on the page because of it.
User flow
The flow starts from a default view a site head can read without touching anything. If the answer is not there, there are four ways to ask more: press a KPI, filter by date, switch tab, or pick a facility. Each one keeps the rest of the page in step, and any selection can be exported.
User flow. How a site head finds what matters, mapped from the original Figma flow.
Key decision
A retrieval page asks the user to build a query before showing anything. Site heads needed the opposite: an answer first, then a way to narrow it.
The default
A data-retrieval page: set the filters, run the query, export the result and analyze it somewhere else.
The decision
Open on a default view that answers the first question. One filter, by KPI, date, tab or facility, then reshapes every section at once, and Back to default is always one press away.
One page, four questions. The same Health Status section, reshaped by a single press, date or facility.
Process
Analyze the recordings
With the product manager, I went through the research recordings and pulled out where site heads got lost.
Map the user flow
I mapped how a site head reads the page and every way they ask more of it, with the decision points, in Figma.
Grayscale wireframes
The wireframes settled the structure: the facility list on the left, one date bar, and sections that all follow the same filter.
High-fidelity on the design system
The final screens use the tokens and components from Augury’s Figma files, with machine-health colors kept for status only.
Wireframes
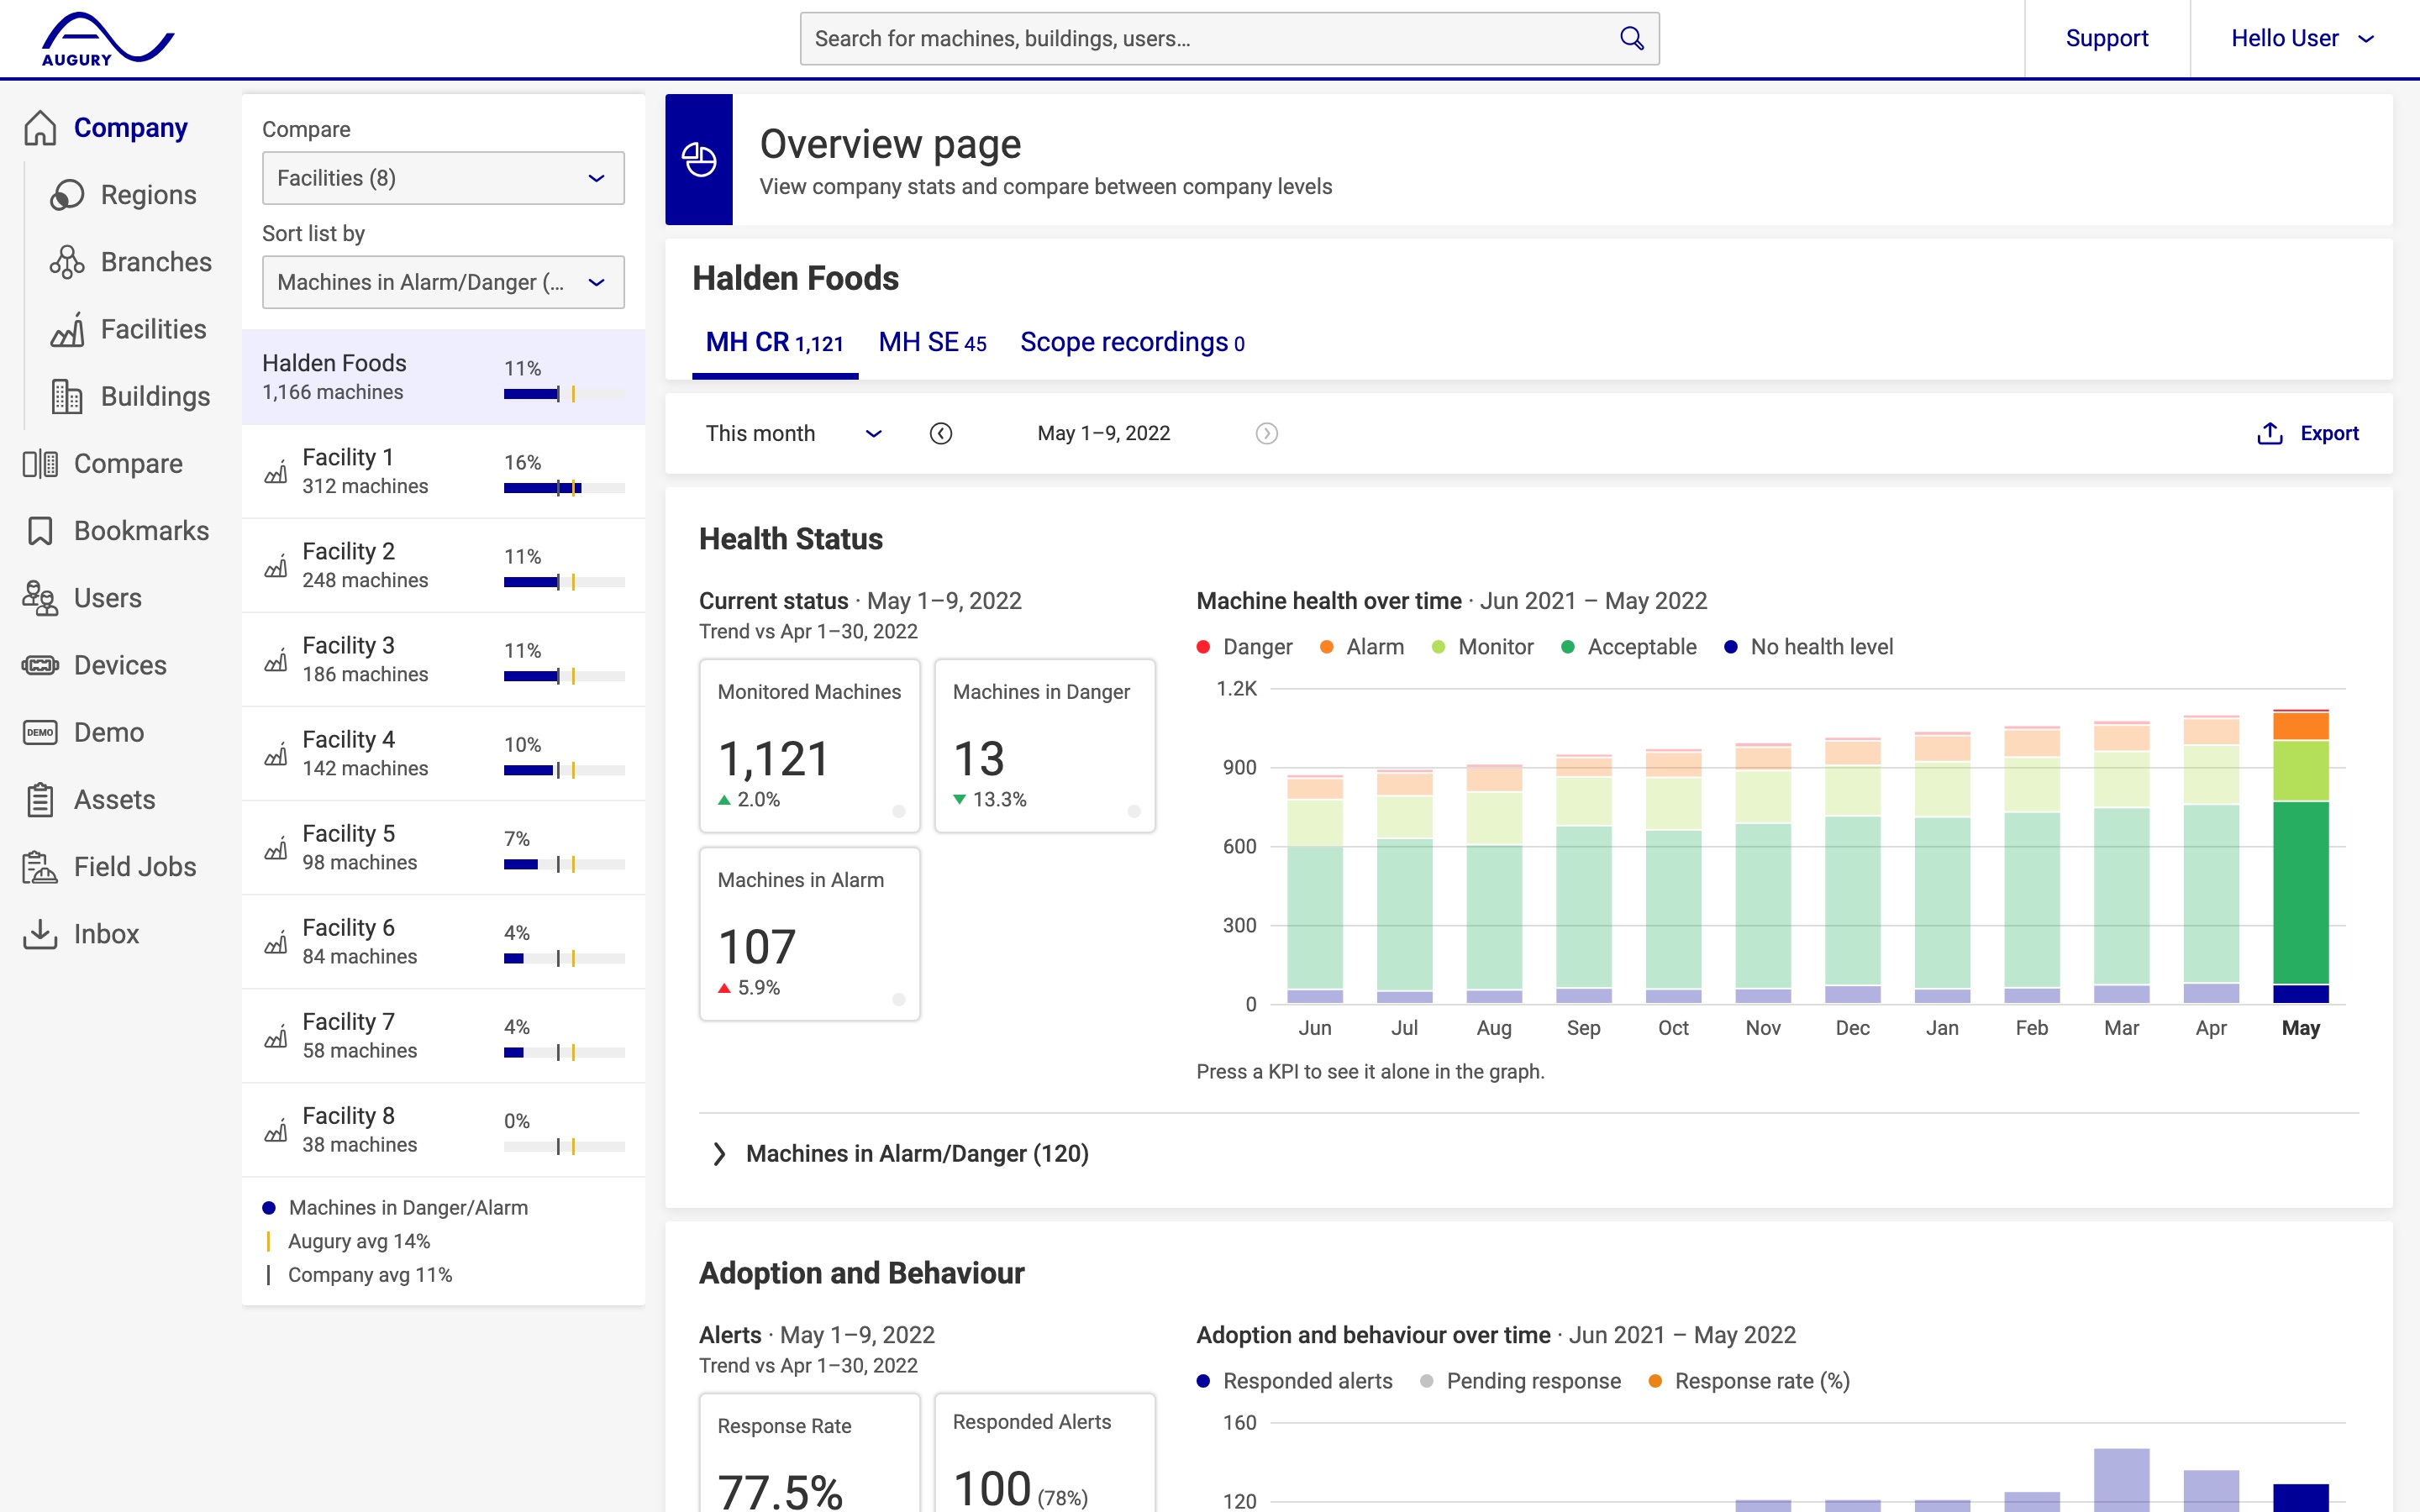
The wireframe fixed what the page shows and in which order. The final design kept the structure and added the brand, the health-status colors, and the Augury and company averages on every facility row.
Overview page. Drag to compare the wireframe with the final design.
The solution
Headlines that name their period
Current status and every chart title name the period and what the trend compares against, so a number is never read against the wrong month.
A KPI that explains itself
Pressing a KPI isolates it in the graph and explains it underneath. A value that is missing reads as -/- instead of a misleading zero.
Facilities against a standard
The facility list sorts by machines in Alarm or Danger and marks the Augury average and the company average on every row.
Repairs turned into reported value
A monthly email and one short dialog let a site head fill in cost and downtime avoided for each repair, and the totals update on the Overview page.
Turning repairs into reported value. One monthly email and one short dialog close the gap in the impact data.
Prototype
A short session: press Machines in Danger, switch to this quarter, then open Bookmarks and fill in the value of a repair. Try the prototype to click through it yourself.
Rebuilt in 2026 from the original user flow, research and Figma files. The customer, facilities and numbers are invented.
Reflection
The brief asked for retrieval. Site heads needed a default view they could trust. Most of the confusion in the research was not about missing data. It was about numbers that did not say which period they covered or what they were compared against. Naming that on the page did more than any new chart.